Injection season is heading down the home stretch, and another large build of 104 Bcf flew past notable historical values. That being said, this triple-digit injection did quite meet market expectations reported in 108-115 Bcf range. Warmer weather has started to get pushed out of the East, only to be replaced with weather patterns that aren’t anything to worry about. Degree days aren’t anything to write home about for the reporting period either. So far, winter is shaping up to be warmer than expected as well. Natural gas storage inventories officially eclipsed the five-year average, albeit by a hair. With two weeks (and potentially more given latest sentiment) of injections ahead, the background state headed into withdrawal season is a stark contrast to last year’s. On the power side, ERCOT Houston and North Hubs are still showing higher than normal monthly averages, but the day-to-day real time index prices have returned to normal ranges. The remaining hubs have been sitting comfortably under their respective five-year averages for most of 2019, but the true test will be once winter comes along. Will the well-supplied storage inventories be enough to combat volatility in its entirety? Spoiler: probably not. It certainly will help maintain more normal NYMEX averages throughout the season, but as we’ve seen with polar vortexes in the past, volatility has no problem showing up uninvited.
Working natural gas in storage currently stands at 3,519 Bcf, which is 494 Bcf (16.3%) higher than this time last year and 14 Bcf (0.4%) higher than the five-year average of 3,505 Bcf for the same time period.
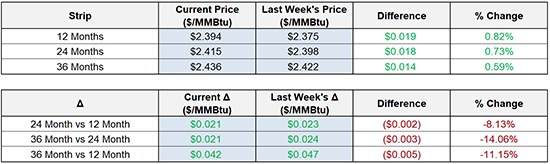
The November 2019 NYMEX Futures price began the day around $2.33/MMBtu prior to the report’s release and increased to $2.34/MMBtu after the report was posted.
Outlook for the Balance of Storage Season:
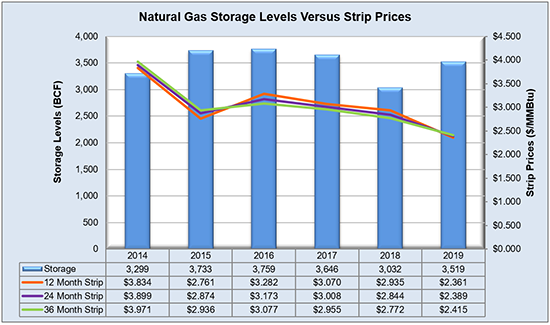
The graph below compares historical 12, 24 and 36 month strip prices and storage levels for the past 5 years.
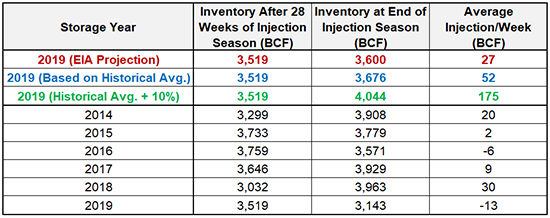
The following table shows the injection numbers we will need to average by week to hit selected historical levels:
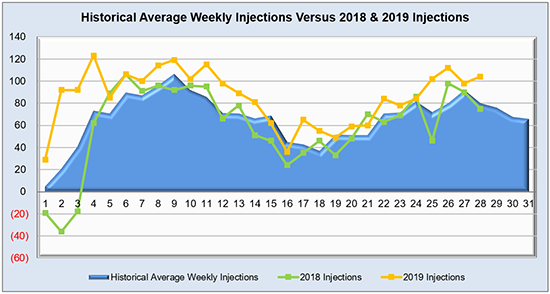
The following two graphs show current natural gas in storage compared to each of the last 5 years and weekly storage averages and patterns.
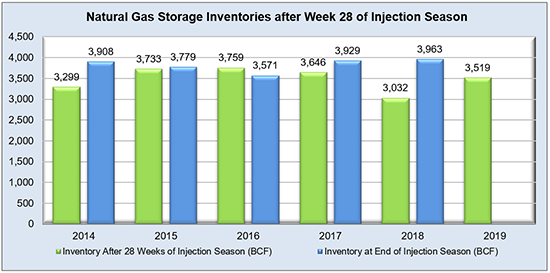
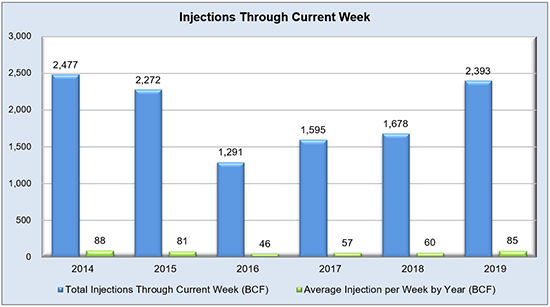
The graph below shows the injections through the current week over the past 5 years.
Finally, the graphics below depicts the 6 to 10 day temperature range outlook from the National Weather Service.
Current Week’s Outlook

Future Outlook
