The end of injection season is here, but the market certainly isn’t spooked about it since this week’s 89 Bcf injection ended up being flat to slightly bearish yet again. Both last year’s build of 49 Bcf and the five-year average of 65 Bcf for the same time period were exceeded along with most market expectations. Colder trends have been cropping up for the first two weeks of November, but the length of their stay is still up for debate based off of both the American and European weather models. Dry gas production continues to hit fresh highs while residential and commercial consumption increase in tandem with gas-weighted degree days piling up slowly. A few more weeks of injections could possibly be in the cards, and most likely, the level of inventories should top out around 3,730 Bcf once withdrawals finally begin to get reported. Real time power hub pricing continues to stay muted, with monthly averages in PJM West, PJM IL North, NYISO Zone J, and ISO-Ne Internal all at five-year lows. ERCOT has recovered from its massive spike in the summer for the most part, but will still need this winter at the least to level back out completely on monthly averages. NYMEX may have seen a notable upward trend over the past few days, but we’ll see what it’s worth if the cold decides to clear out.
Working natural gas in storage currently stands at 3,695 Bcf, which is 559 Bcf (17.8%) higher than this time last year and 52 Bcf (1.4%) higher than the five-year average of 3,643 Bcf for the same time period.
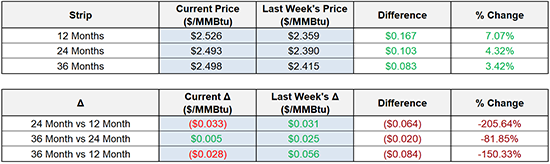
The November 2019 NYMEX Futures price began the day around $2.68/MMBtu prior to the report’s release and dropped to $2.66/MMBtu after the report was posted.
Outlook for the Balance of Storage Season:
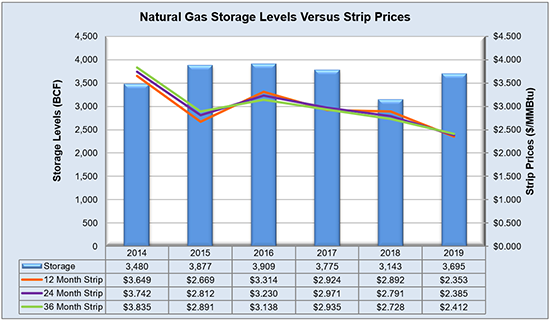
The graph below compares historical 12, 24 and 36 month strip prices and storage levels for the past 5 years.
The following table shows the injection numbers we will need to average by week to hit selected historical levels:

The following two graphs show current natural gas in storage compared to each of the last 5 years and weekly storage averages and patterns.
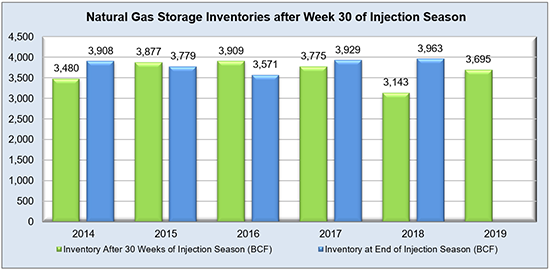
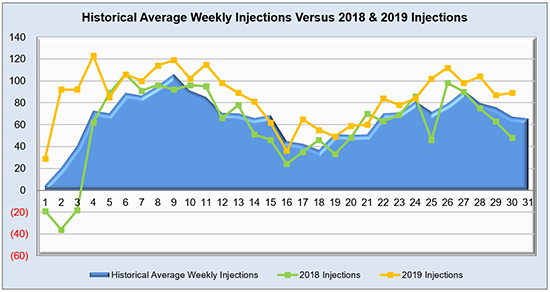
The graph below shows the injections through the current week over the past 5 years.
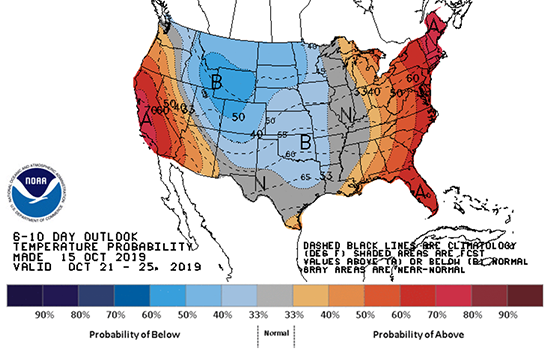
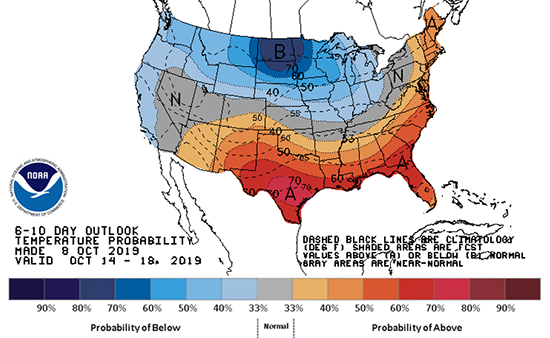
Finally, the graphics below depicts the 6 to 10 day temperature range outlook from the National Weather Service.
Current Week’s Outlook
Future Outlook