
Energy Market Update
Weekly Energy Industry Summary
Commodity Fundamentals
Week of February 3, 2025
By The Numbers:
NG '25 prompt-month NYMEX settled at $3.31 per MMbtu, up $.31/MMbtu, Monday, February 3.
WTI '25 prompt-month crude oil settled at $73.16 per barrel, up $.63 per barrel on Monday, February 3.
Natural Gas Fundamentals - Neutral
Prompt-month NYMEX natural gas settled at $3.31 per MMbtu, up $.31/MMbtu on Monday, February 3.
A warm up has been underway for more than a week after a cold January.
The warm up is expected to carry on this week, but may be interrupted by shots of cold air and a more variable pattern in the 11-15 day period.
Natural gas storage inventories have taken a draw down and that will continue into next week as cold winter air is re-setting end-of-season inventory models.
Electric power generation demand for gas, year-to-date, averaged 36.9 Bcf per day versus 36.1 Bcf per day for the same period last year.
Residential/commercial demand for gas year-to-date averaged 49.1 Bcf per day versus 44.5 Bcf per day for the same period last year.
LNG exports month-to-date averaged 14.5 Bcf per day versus 13.8 Bcf per day for the same period last year.
Given the winter weather and draws on storage, a repeat of the last two years' pricing action wherein a major price collapse occurred in the first quarter is moving off the table.
Crude Oil - Neutral
NYMEX (WTI) crude oil futures settled at $73.16 , up $.63 per barrel on Monday, February 3.
Crude oil was down in morning trading (2-4-25) as tariffs took affect on Chinese exports to the U.S.
President Trump announced a "maximum pressure campaign," on Iran giving some support to crude oil.
President Trump's tariff on Canadian crude oil was announced and rescinded (for 30 days) before it became effective as Canada's Prime Minister announced cooperation with the U.S. on border and narcotics enforcement.
The general trope of China's stalling economy and Europe in near recession continues to hamper demand expectations for 2025.
Economy - Neutral
Tariffs everywhere; but what do they mean and what will they do, or not do?
U.S. tariffs on Mexico and Canada were postponed yesterday for thirty days as both countries agreed to bolster border security, send troops, military and law enforcement assets to their borders, and negotiate various trade issues.
The Trump Administration levied a 10% tariff on Chinese imports effective today. China retaliated.
President Trump said that talks with China are on-going on trade but that recent actions were just "an opening salvo."
Technology and energy stocks have largely recovered from the steep sell-off last week pursuant to DeepSeek, a Chinese AI company's claim to have replicated an AI solution at a fraction of the cost of larger competitors.
Weather - Bearish
A warm up is on the move throughout the country as cold arctic air gives way to above normal temperatures.
The 11-15 day period is warmer than normal over the entire eastern two thirds of the country.
There is available cold air for the Lower 48, and the models are beginning to show that this air will make its way south in a more variable pattern.


Weekly Natural Gas Report:
Inventories of natural gas in underground storage for the week ending January 24, 2025 are 2,571 Bcf; a withdrawal of 321 Bcf was reported for the week ending January 24, 2025.
Gas inventories are 111 Bcf greater than the five-year average and 144 Bcf less than the same time last year.

Values reflect week ending January 31, 2025.

Prices reflect week ending January 31, 2025.
Weekly Power Report:

Prices reflect week ending January 31, 2025.

Prices reflect week ending January 31, 2025.
Mid-Atlantic Electric Summary
The Mid-Atlantic Region’s forward power prices are lower over the past week as warmer temperature outlooks for the early part of February weighed downward on natural gas prices last week but reversed a bit on Monday. The Mid-Atlantic and Midwest regions seem to be the dividing line between the extremely cold temperature in Canada and the northern US and the warmth expected from the south. This back and forth pattern could provide intermittent price support and resistance in this region. Broadly speaking we are looking at a much warmer than normal pattern over the eastern United States this week, then see colder changes next week as cold air is released from western Canada and the Pacific Northwest. For the most part, the models show the coldest air moving into the Mid-con with variability downstream in the East that leans toward colder than normal. Future power prices from 2026-2030 were -3% lower over the past week. Index prices have been lower so far this month with a milder start to February. The month-to-date index prices in West Hub for February are averaging $35.34/MWh, which is -47% lower than last month, but 42% higher than last year at this time.
PJM Responds to Political Pressures with Cap and Floor on Capacity Prices – On 1/28, PJM notified Members of an agreement in principle with the Shapiro administration on a path forward for the 12/30 complaint filed by Governor Shapiro and the Commonwealth of Pennsylvania proposing a return to the previous price cap in PJM’s capacity market of 1.5 times the Net Cost of New Entry for the next two auctions for 2026/27 and 2027/28 delivery years. Governors from Maryland, Illinois, New Jersey, and Delaware supported the complaint at FERC. PJM will consult with the Members Committee on 2/7 regarding the agreed cap (~$325/MW-day) and floor (~$175/MW-day) for auction clearing prices for the 2026/27 and 2027/28 delivery years.


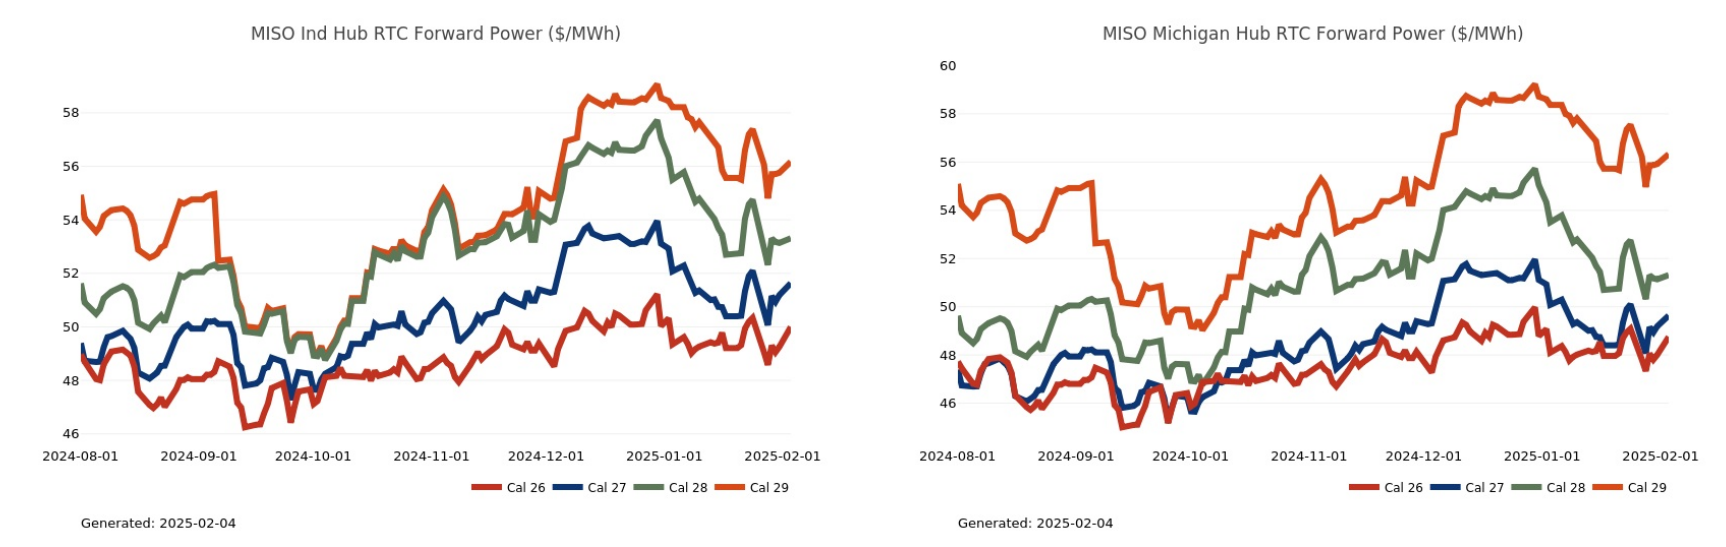
Great Lakes Electric Summary
The Great Lakes Region’s forward power prices are lower over the past week as warmer temperature outlooks for the early part of February weighed downward on natural gas prices last week but reversed a bit on Monday. The Mid-Atlantic and Midwest regions seem to be the dividing line between the extremely cold temperature in Canada and the northern US and the warmth expected from the south. This back-and-forth pattern could provide intermittent price support and resistance in this region. Broadly speaking we are looking at a much warmer than normal pattern over the eastern United States this week, then see colder changes next week as cold air is released from western Canada and the Pacific Northwest. For the most part, the models show the coldest air moving into the Mid-con with variability downstream in the East that leans toward colder than normal. Future power prices from 2026-2030 were -3% lower over the past week. Index prices have been lower so far this month with a milder start to February. The month-to-date index prices in COMED for February are averaging $26.36/MWh, which is -37% lower than last month but 26% higher than a year ago, while AdHub prices are averaging $32.34/MWh or -43% lower than last month but 38% higher than last year in February. The month-to-date index prices in Ameren for are averaging $29.46/MWh, which is -38% lower than last month and 26% higher than a year ago, while in Michigan they are averaging $31.08/MWh or -37% lower than last month but 25% higher than last year in February.
PJM Responds to Political Pressures with Cap and Floor on Capacity Prices – On 1/28, PJM notified Members of an agreement in principle with the Shapiro administration on a path forward for the 12/30 complaint filed by Governor Shapiro and the Commonwealth of Pennsylvania proposing a return to the previous price cap in PJM’s capacity market of 1.5 times the Net Cost of New Entry for the next two auctions for 2026/27 and 2027/28 delivery years. Governors from Maryland, Illinois, New Jersey, and Delaware supported the complaint at FERC. PJM will consult with the Members Committee on 2/7 regarding the agreed cap (~$325/MW-day) and floor (~$175/MW-day) for auction clearing prices for the 2026/27 and 2027/28 delivery years.

Northeast Energy Summary
On January 27, the Massachusetts Department of Public Utilities (DPU) issued an Order (Docket 24-160) approving the settlement for transmission service from the New England Clean Energy Connect (NECEC) project, which will bring 1,200 MW of Canadian hydroelectricity to New England over 20 years. The DPU initially approved the PPAs in 2019, but legal and political disputes in Maine delayed project construction, resulting in an additional $521 million in costs to the project, whose original cost was about $1 billion. The legal disputes were resolved in April 2023, project construction resumed that October, and the project is now expected to come online in 2026. The project developer, Avangrid, will be able to recover only the costs related to the construction delay, not inflation or supply chain delays. Despite the $521 million increase in project costs, supporters of the agreement project that utility customers will pay approximately $1.50 less per month when the project is in service.
Last month, New Yorks Governor Hochul delivered her fourth State of the State Address, outlining her policy agenda for the 2025 legislative session. The speech focused on the sustained concerns voters have expressed over the cost of living and inflation, with priorities to assist families with childcare, food, medicine, etc. Additionally, over $1 billion in new spending will be directed towards reducing household energy bills (by retrofitting homes and incentivizing the installation of heat pumps) and emissions. While sparse on details, Hochul’s address does include energy and climate-related proposals. Citing affordability concerns, Hochul proposed a delay of the much-anticipated draft regulations of the state’s to-be-implemented economywide cap-and-invest program. Regulations for the program were due last year but, with the delay, companies will instead be required to report their emissions with proposed new reporting regulations to gather information on emissions sources due at some point this year.
In December, Governor Hochul signed S2129B – Establishing the Climate Change Adaptation Cost Recovery Program and the Climate Change Adaptation Fund. This law imposes cost recovery demands on fossil fuel companies, requiring them to pay a fee to the State for climate recovery based on their contributions to greenhouse gas emissions (based on tons of CO2 equivalent emissions). The law seeks a total cost recovery of $75 billion, or $3 billion annually over 25 years. The law requires the New York Department of Environmental Conservation (DEC) to promulgate regulations to identify which parties will be subject and how much they owe to the State. Notably, all funds collected by this program will be deposited into a new Climate Change Adaptation Fund, which will be used to fund climate change adaptive infrastructure projects in the State, such as upgrading stormwater and sewage infrastructure, repairing roads, and installing energy efficiency projects. The law directs DEC to develop and release a Statewide Climate Change Adaptation Master Plan, which would provide more details on the dispersal of funds, within two years (December 2026).


ERCOT Energy Summary
Temperatures moderated last week across Texas, with daytime highs getting up into the upper 60’s in Dallas and low 70’s in Houston as cold air was contained to western Canada and warmer Pacific air came across the Lower 48 states. There is definitely a short-term break to the strong winter demand we had seen the past few weeks.
The forecasts became a little trickier over the weekend with colder changes next week. In the near-term we’ll have an unseasonably warm pattern this week with some highs in the 80s. The pattern starts to turn colder in the Mid-con next week, but the models differ on how much cold air makes it into Texas. For the most part they show first category below normal temperatures, but much below normal is shown to our north and the models are struggling to handle details in the pattern. Bottom line: Spring break this week, then chilly in week two.
Forward Calendar Price Review Last Week

Source: ERCOT
ERCOT Real Time Prices
Last week, real time prices averaged in the low $20/MWh across the North, Houston & South zones with the West clearing $45 as congestion once again drove higher pricing.

Source: ERCOT
Net Load
Net load in ERCOT is defined as overall ERCOT system load less combined (solar & wind) output. The large build out in solar and wind capacity in ERCOT has led to variability in ERCOT net load and as the graph below illustrates, it can vary day to day. When the green line reaches the gray line, it indicates there are very little renewable capacity online.
On January 31st wind generation was weakest that week during sunset at 6 pm CT when load was 47.9 GW and net load was 45.8 GW. This was up from on 17 GW of net load at 2 pm CT. Wind was strong the balance of the week.

Source: GridStatus.io
Generator Outages:

Source: ERCOT & Grid Status
Outages peaked at 9.6 GW on January 29th and are currently at 6.4 GW. They are forecasted to decline over the course of the coming week will decline to 4 GW if the forecast is accurate. Milder weather will allow this to occur but if we get a cold shot again in mid-February, they could rise again.
ERCOT/TX News
Last Friday, January 31st was a good example of ERCOT’s challenges in meeting net load obligations around sunset hours as solar capacity declines. In the graph below, the dark green represents wind generation, yellow is solar, purple is energy storage and blue is natural gas. Coal and nuclear are the other baseload dispatchable sources but natural gas has the largest swing capacity in ERCOT. The low wind on January 31st required a 28 GW swing in dispatchable resources from 2 pm CT to 6 PM CT as mentioned about in the section about net load.

Source: ERCOT & GridStatus.io
PUCT Meeting
Firm Fuel Supply: At the PUCT meeting last week, Texas commissioners approved those resources eligible to provide Firm Fuel Supply in winter months if a definition was changed for a that of a qualifying pipeline. If the definition was changed it was determined that up to an additional 57 resources might qualify to offer firm fuel supply to ERCOT in winter month. This would likely require those resources to hold firm transport rights on the existing pipelines.
Transmission Planning: As the PUCT commission considers how to address load growth, ERCOT’s Vice President of System Planning and Weatherization testified to the commissioners that the build out of a new 765-kV “backbone” transmission backbone network would only cost ~4% more than expanding the existing 345 -kV system. The 765 kV plan is being considered to support growth in the Permian basin region. The 345 kV system has been in place in ERCOT since the 1960’s but either upgrading the system would require would cost at least $5 billion annually over a six-year planning horizon. Total cost of the new 765 kV lines would be $33 billion vs. ~$31 billion for the 345 kV plan. The PUCT is looking to vote on the new transmission plan in April.
More information on the ERCOT transmission plan can be found at https://www.ercot.com/files/docs/2025/01/28/ERCOT_Trending_Topic_345-kV_vs_765-kV_Transmission.pdf


Source: ERCOT


CAISO, Desert Southwest and Pacific Northwest Energy Summary
Spring like temperatures will dominate from the interior West and Rockies into the Desert Southwest throughout the course of this week before the pattern turns colder this weekend. With the exception of the Desert Southwest cities where temperatures will remain closer to normal, the pattern heading into next week look like it will feature widespread below to much below normal temperatures across the Western U.S. A colder than normal pattern is on track to dominate the Pacific Northwest through the first half of the month with widespread much- to strong below-normal temperatures which will include population centers closer to the coast. In terms of a storm track, the bulk of one looks focused across California this week before trends suggest more of a Northwest focus next week and into the 11-15 day period.
After the coldest January in 15 years, the extended winter prediction from a large Pennsylvania rodent and tariffs, the landscape for natural gas is a complex one. Traders dislike uncertainty, so the path of least resistance for prices is higher. Even with a pullback in prices this morning, the Nymex prompt month remains close to $3.25 after closing Friday at $3.04 MMBtu. Closer to home, SoCal city gate settles bounced from the lowest settlement in a month ($3.64 for the three-day weekend package on Friday) to $3.88 for flow today (Tuesday). This weekend also brought SoCal their first storage injections in weeks, but this was followed by a low operational flow order (OFO) being declared for Monday evening with an expectation for more given the colder weather on its way. PG&E will likely see an increase in power burn demand this week as storms boost demand and the extreme cold keeps megawatts from traveling south from the Pacific Northwest into NorCal. Thinking ahead however, the rainfall and rising snowpack levels will eventually translate to healthy spring/summer hydro generation, eating into the need for power burns. Basis for Q3 city gates remains close to $0.50 for PG&E and $1.00 for SoCal.
An incursion of arctic air into the PNW cities remains the big story for CAISO prices at the start of this week. That extended stretch of cold will keep power generation produced in the Northwest home as next day Mid-C prices soared on Monday to the low-$200s while the best NP15 prices could muster was a measly mid-$60s print during peak hours for flow today. This pricing dynamic looks to stick around as Mid-C bal month prices fell into the $135 - $140 range yesterday while NP15 was only in the mid-$50s per MWh. This will translate to a reduction in imports and the need for CAISO to boost NP15 gas and hydro generation. It also leads to a wide gap forming between NP15 and SP15 day index settles, especially during peak hours, as solar production in the south maxes out the capability of the interties moving those electrons north. Congestion in the day ahead prints has moved from the $20 to $30 level but has zoomed higher in the real time as moderate SP15 loads and strong “solar irradiance” in the deserts dropped prices to -$51.72 on Sunday and to -$22.08 yesterday.
Couple thoughts on the on-the-off tariff situation that roiled gas and oil markets to start the week. The potential impacts are broad, but the nation’s reliance on Canadian gas is not evenly distributed. Areas like the Gulf Coast are well insulated against either a price increase on gas coming from Canada or a reduction in imports because there’s alternatives. The opposite is true for the population centers in Washington and Oregon since they rely heavily on molecules coming in on the Northwest Pipeline which is fed by British Columbia production. An increase in costs here will eventually make their way south to California, or a reduction in flow will raise the need for imports from the Rockies and Permian zones, lifting prices.
