
Energy Market Update
Weekly Energy Industry Summary
Commodity Fundamentals
Week of June 9, 2025
By The Numbers:
NG '25 prompt-month NYMEX settled at $3.64 per MMbtu, down $.15/MMbtu, on Monday, June 9.
WTI '25 prompt-month crude oil settled at $65.29 per barrel, up $.71 per barrel on Monday, June 9.
Natural Gas Fundamentals - Neutral/Bearish
Prompt NYMEX natural gas settled at $3.64 per MMbtu, down $.15/MMbtu on Monday, June 9.
Over the past week gas has had a floor of $3.50 and a ceiling of $3.75 per MMbtu.
June has gotten off to a relatively cool start compared to the past decade where summer has kick-started quite early.
Storage injections continue to trend well-above-normal and storage has moved from bullish in the first quarter, to "neutral/bearish" in the second quarter.
Production, YTD is 104.5 Bcf per day versus 101.4 Bcf per day for the same period last year, up 3.1 Bcf per day.
Power demand YTD is 32.5 Bcf per day versus 32.5 Bcf per day for the same period last year.
Residential/Commercial demand YTD 29.5 Bcf per day versus 25.9 Bcf per day for the same period last year, up 3.6 Bcf per day.
Industrial demand YTD is 24.3 Bcf per day versus 23.8 Bcf per day for the same period last year, up 0.5 Bcf per day.
LNG exports YTD are 15.3 Bcf per day versus 13.0 Bcf per day for the same period last year, up 2.3 Bcf per day.
Exports to Mexico are 6.4 Bcf per day versus 6.0 Bcf per day for the same period last year, up 0.3 Bcf per day.
Bottom line, summer weather in the Great Lakes Region, the Mid-Atlantic, and the Midwest is coming, but it's not nearly as intense as the past several years -- power demand is rising but at a tempered rate relative to weather -- storage injections will be higher-than-average and are a check against major upside in the very near term.
Crude Oil - Neutral/Bullish
NYMEX (WTI) prompt-month crude settled at $65.29/bbl, up $.71 per barrel on Monday, June 9.
Crude oil rose 7% over the past week on the back of renewed optimism over U.S.-China trade talks.
OPECs crude oil production in May increased less than called for in the OPEC agreement.
Morgan Stanley reports that it expects OPEC to increase output by 420,000 bbls per day by September.
The crude oil market is well supplied at current production levels, however, positive news or negative news on the state of U.S.-China trade talks are a primary driver in the coming days/weeks.
Economy - Neutral
Nonfarm payrolls rose 139,000 for May, above the Dow Jones estimate of 125,000.
The unemployment rate held at 4.2%.
Worker pay grew "more than expected" with average hourly earnings up 0.4% during the month and 3.9% from a year ago.
The Atlanta Federal Reserve Bank estimate for GDP growth in the second quarter is 4.6 percent.
U.S. GDP contracted 0.3% in the first quarter.
Uncertainty remains on trade.
Equities markets have largely recovered from their sell-off in April.
Gold prices continue to rally.
Weather - Neutral
The focus is heat in the West and a variable pattern downstream oscillating between above and below normal temperatures over the eastern half of the nation.
Previous models showed more heat developing in the eastern half of the country, but have moderated over the past several days.
The general outlook is for heat in the west to move intermittently to the east.
Major heat anomalies in the eastern half of the country are not forecast for the coming week.
Summer is arriving, but it's not as hot as it has been in recent years during the first half of June.


Weekly Natural Gas Report:
Inventories of natural gas in underground storage for the week ending June 5 are 2,598 Bcf; an injection of 122 Bcf was reported for the week ending June 5.
Gas inventories are 117 Bcf above the five-year average and 288 Bcf less than the same time last year.

Values reflect week ending June 6, 2025.

Prices reflect week ending June 6, 2025.
Weekly Power Report:

Prices reflect week ending June 6, 2025.

Prices reflect week ending June 6, 2025.
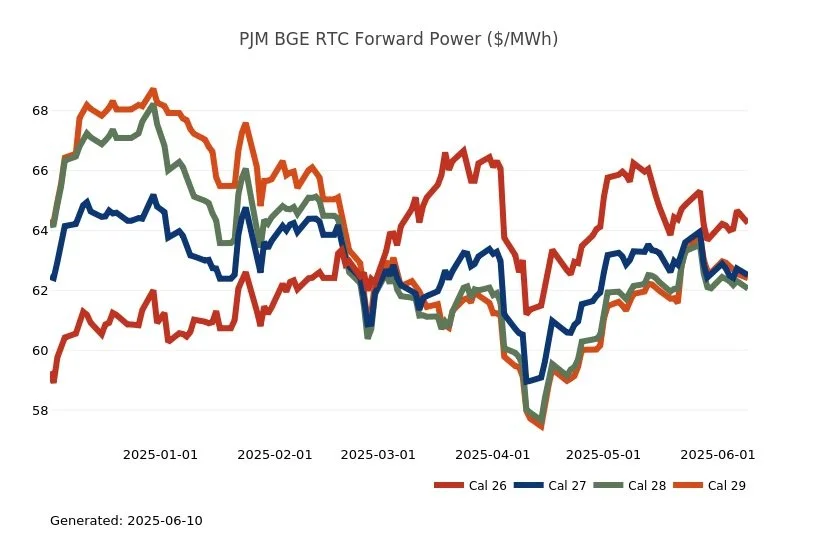
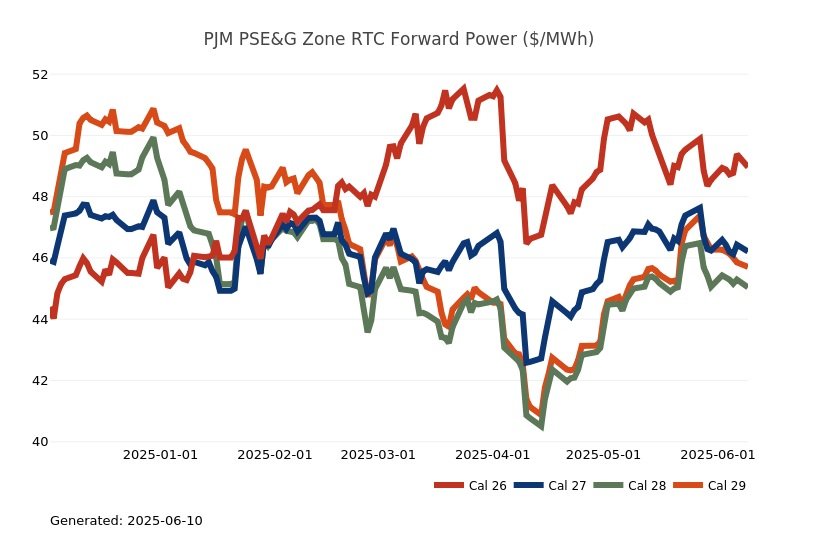
Mid-Atlantic Electric Summary
The Mid-Atlantic Region’s forward power prices were relatively unchanged over the week as the market continues to balance forecasts for above average temperatures in June and lower production numbers, with a string of triple-digit natural gas storage injections along with less feedgas flowing into US LNG export facilities. The main theme of the weather pattern remained unchanged, with the best chances for above and much above normal temperatures in the West, with pulses of warmth moving across the North and East. The eastern United States continues to experience an unsettled pattern, which brings some unevenness to the forecasts. Power futures were unchanged, on average, throughout the 2026-2030 price curve, on the week, with only a slight uptick in the Cal’26 strip of ~1%. The final, day-ahead settlement price in West Hub averaged $35.04/MWh for May, which is -24% lower than the previous month of April but was 6% higher than a year ago for that month.
PJM has released its proposal for the 2025 Quadrennial Review of the capacity market, detailing updates to the Variable Resource Requirement (VRR) Curve, Cost of New Entry (CONE), and Net Energy and Ancillary Services (E&AS) Offset methodology. Rather than adopting Brattle’s recommendation to replace the Net CONE with a “Reference Price”, PJM is proposing using a combined-cycle gas turbine as the reference resource across all zones, except for ComEd, where a 4-hour battery energy storage system (BESS) is proposed due to policy constraints under the Climate and Equitable Jobs Act. For the Net E&AS Offset, PJM supports maintaining its status quo forward-looking methodology incorporating updated parameters reflecting the new reference resources and introducing a new approach for BESS units. PJM proposes to enhance price stability by modifying VRR curve parameters, including setting Point A at the Max (1.75 x Net Cone, 0.6x Gross CONE) and Point B at 0.5x the price cap.


Great Lakes Electric Summary
The Great Lakes Region’s forward power prices were relatively unchanged over the week as the market continues to balance forecasts for above average temperatures in June and lower production numbers, with a string of triple-digit natural gas storage injections along with less feedgas flowing into US LNG export facilities. The main theme of the weather pattern remained unchanged, with the best chances for above and much above normal temperatures in the West, with pulses of warmth moving across the North and East. The eastern United States continues to experience an unsettled pattern, which brings some unevenness to the forecasts. Power futures were unchanged throughout the 2026-2030 price curve, for the most part, with only a slight uptick in the Cal’26 strip of ~2%. The final, day-ahead settlement price in COMED averaged $29.55/MWh for May, which is 25% higher than the previous month of April as well as being 20% higher than a year ago for that month, while in AdHub those prices are averaged $32.65/MWh or were -28% lower the past month, but 6% higher year-over-year. In Michigan, final settlement prices averaged $34.53/MWh or were -6% lower than April but 21% higher last year, while Ameren index prices averaged $32.28/MWh or were 10% higher than the previous month as well as being 18% higher than the previous year for the month of May.
PJM has released its proposal for the 2025 Quadrennial Review of the capacity market, detailing updates to the Variable Resource Requirement (VRR) Curve, Cost of New Entry (CONE), and Net Energy and Ancillary Services (E&AS) Offset methodology. Rather than adopting Brattle’s recommendation to replace the Net CONE with a “Reference Price”, PJM is proposing using a combined-cycle gas turbine as the reference resource across all zones, except for ComEd, where a 4-hour battery energy storage system (BESS) is proposed due to policy constraints under the Climate and Equitable Jobs Act. For the Net E&AS Offset, PJM supports maintaining its status quo forward-looking methodology incorporating updated parameters reflecting the new reference resources and introducing a new approach for BESS units. PJM proposes to enhance price stability by modifying VRR curve parameters, including setting Point A at the Max (1.75 x Net Cone, 0.6x Gross CONE) and Point B at 0.5x the price cap.


Northeast Energy Summary
On May 29, the Maine state legislature voted Ought Not To Pass on LD1358, which would have allowed affiliates of an electric distribution company (EDC) to own and operate generation facilities in the state. This was one of two bills introduced this year related to utility-owned generation. The other, LD1592, which would have allowed an EDC to directly own generation, was voted Ought Not To Pass in the legislature earlier this month. Proponents of the bills argued that they would reduce increasing electricity rates.
On June 2 & 3, the Connecticut state Senate and House, respectively, passed SB 4, An Act Concerning Energy Affordability, Access and Accountability. The omnibus energy legislation is the legislature’s answer to public outcry concerning increasing electric rates over the summer. The bill seeks to reduce costs by requiring studies on several programs to determine where cuts can be made, requires electric distribution companies (EDCs) to formulate plans for implementing time-varying rates, allows EDCs to use nuclear energy from the existing zero-carbon procurement contract to be used to provide standard service, allows the EDCs to include 25% of the standard service load to be procured on ISO-NE markets, and reduces Class I Renewable Portfolio Standard (RPS) requirements for 2026 through 2030. The decrease in RPS requirements could reduce supplier costs by $2-4/MWh, depending on term and customer-specific load. Governor Ned Lamont said he intends to sign the bill in to law in the coming days.
Last week the NYISO published its annual “Power Trends“ report, escalating its warnings that new renewables are not coming online fast enough to meet growing energy demand, explicitly backing additional fossil fuel plants to keep the lights on. NYISO’s President and CEO, Rich Dewey, underscored the need for immediate investment in dispatchable generation to address the increasing energy demands and New York’s aging infrastructure. NYISO’s call for new gas plants and repowering of older plants is a departure from prior subtle suggestions and highlights the difficulties New York faces in transitioning away from fossil generation while ensuring reliability. In its report, NYISO further calls for policy and regulatory support to facilitate the development of new energy infrastructure. This includes streamlining the approval process for new projects and providing incentives for investment in dispatchable generation and infrastructure upgrades. The PSC currently has a multi-year open proceeding to examine and explore incentive programs for emission-free dispatchable generation. As electrification programs and new large-load customers associated with economic development initiatives are pushing projected demand higher, NYISO’s warnings are taking on a new urgency. Governor Kathy Hochul has demonstrated openness to new energy sources, including nuclear and gas pipelines, to ensure sufficient power for large projects, but her administration has previously blocked proposals for repowering gas plants. New York is projected to become a winter-peaking electric system by the 2040s, driven primarily by electrification of space heating and transportation. On the coldest days, the availability of natural gas for power generation can be limited, and interruptions to natural gas supply will introduce further challenges for reliable electric grid operations. A tightening supply/demand balance has been supportive of prices in 2025 relative to year ago and 5-year average levels. The timing of load growth, infrastructure development, and policy and regulatory directives will determine the extent of future volatility as reliability and resiliency issues come to the forefront.


ERCOT Energy Summary
For the first full week of June, we saw temperatures start in the low 90’s and climb to the mid 90’s later in the week before falling back to the 90F level as a cold front moved in over the weekend.
Overnight storms moved across eastern Texas on Monday. We still have some heat in Houston and San Antonio today (Tuesday), but a wetter pattern will bring temperatures down for the remainder of this week. The pattern starts to warm up again over the weekend into next week, with highs back in the lower 90s. The American operational and Canadian models show middle and upper 90s possible in the 11-15 day, while the European and model ensembles keep it in the lower 90s.
Wind will dip on 6/10 and 6/11 to 8-9 GW before rising again later this week to 10-13 GW. Solar will be strong at 10.5 GW flat load the entire week.
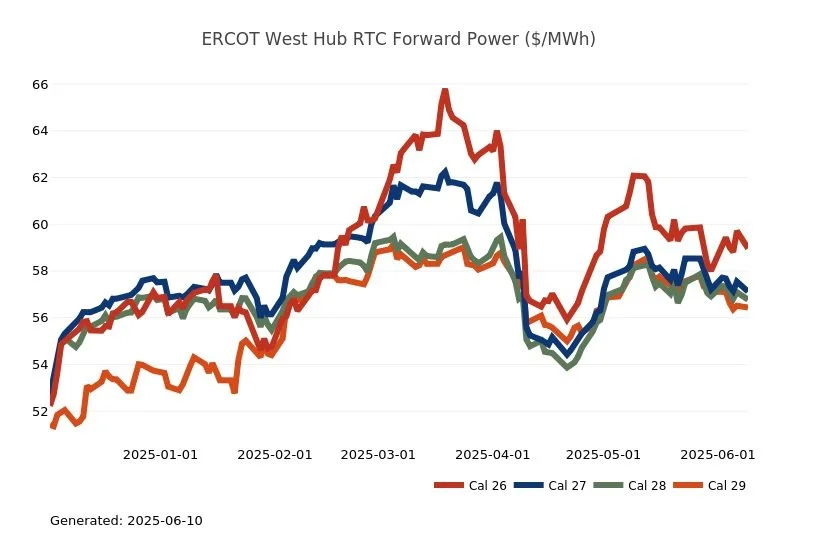
ERCOT Forward Prices:
The forward calendar strips week over week and month over month basis were the following:

Source: ERCOT
ERCOT Real Time Prices
Real time prices were calm overall last week as temperatures were only in the mid-90s and wind was strong, averaging between 13-18 GW on a flat basis most days. This provided more than an adequate generation reserve margin. The highest price point in the week came for the Houston zone, which saw a spike to average $448/MWh on June 5th from 12-1 pm CT (HE 13).

Wind and Solar Output:
Solar hit a new preliminary output record of 27,036 MW on May 12th. Last week saw overall little price volatility with the exception of May 8th when prices spike to $4,528/MWh at 8-9 pm CT. Wind generation was only ~3.5 GW.
Two weeks ago, ERCOT achieved a two combined solar and wind renewable output records. The first was for 41,675MW on April 13th at 4:40 PM CT and the second was for 41,916 MW at 2:45 PM CT on April 17th. See below. Prices were stable most of last week.
Battery capacity saw a Maximum storage record of 5,970 MW on 4/10 at 7:30 pm CT and the 5th new record in 2025, up from 4,587 MW on February 20th.

Source: https://www.gridstatus.io/live
Generator Outages:
Thermal outages held steady at 15 GW last week and appear to likely hold that level for the near future.

https://www.gridstatus.io/graph/ercot-outages?iso=ercot&outageType=thermal
Source: ERCOT & Grid Status
TX Legislature, PUCT, & ERCOT News:
TX Energy Fund Loan Extension: In an acknowledgement that the PUCT may need more time to complete its due diligence of TX Energy Fund participants and that they may not be ready to take initial withdrawals from the state fund by December 31, 2025. This is likely due to the fact they may not be ready to break ground. The Legislature passed SB 2268 Texas Energy Fund Loan Extension and sent to the Governor for his signature. As the PUCT is working thru its due diligence, SB 2268 grants the PUCT on a case-by-case basis the ability to extend the disbursement deadline beyond December 31, a change in statute sought by the PUCT Chairman.
Independent Market Monitor (IMM) Filed the ERCOT 2024 State of the Market Report - Potomac Economics, the ERCOT Independent Market Monitor, filed the ERCOT 2024 State of the Market Report on 6/3. The report provides an independent assessment of the outcomes of the wholesale electricity market in ERCOT. Key results in 2024 include:
Competitiveness of the market: The ERCOT energy markets performed competitively in 2024, and the IMM found little evidence that suppliers exercised market power in the ERCOT energy market. However, the IMM does believe that significant market power exists at both the system and zonal levels, and that market power mitigation provisions may be warranted.
Power supply and demand: Peak demand had little change, but average demand increased by 3.5%. An influx of new supply, composed of mostly solar and energy storage, contributed to fewer tight system conditions in 2024. The shift of resource mix contributed to the shift of Peak Net Load into evening hours and the change of capacity factors during those hours.
An example of how the ERCOT market is evolving around Net Load hours is illustrated in the chart below from the IMM report. It highlights the hours in the day where real time prices have spiked, the average impact of the price spikes on average price and the number of spikes as illustrated by the green triangles. As the IMM explains; “this trend is largely a result of the increase in solar generation, which lowers average prices in the daytime when demand is high but increases the likelihood of price spikes while the sun is going down and demand remains high. During these ramp-down periods, SCED commonly dispatches quick-start natural gas plants or energy storage resources with high priced energy offer curves, resulting in an increase in the frequency of price spikes despite having lower energy prices on average.”

Source: ERCOT & Potomac Economics
Market outcomes and performance: In general, both energy and ancillary service prices and costs dropped significantly in 2024 due to an increase in supply. The increase in generation from solar resources largely contributed to an increase of Operating Reserve Demand Curve (ORDC) and Reliability Deployment Price Adder (RDPA) price spikes in comparison to 2023, in addition to forecasting errors.
The report reviewed and emphasized a list of proposed future market design improvements including:
Implementing shortage pricing and procurement for ancillary services under RTC to manage reserve uncertainty.
Adding an Uncertainty Reserve Product to address operational reliability issues stemming from uncertainty in the forecast for renewable generation.
Implementing a multi-interval Real Time Market to efficiently dispatch online resources to serve forecasted load; moving away from 4CP and implement a transmission cost allocation framework that more accurately reflects cost causation; and Prioritizing development of market solutions for ensuring resource adequacy.
In accordance with the list of improvements above, the report contains six new recommendations, carries over nine of their past recommendations, and retires six past recommendations. The Public Utility Commission is already expected to holistically review 4CP and transmission cost allocation


CAISO, Desert Southwest and Pacific Northwest Energy Summary
Near record heat continues in the Northwest today after the region has seen a string of similar days in the first heat wave of the season. Temperatures are also expected to be in the low to mid 90s across much of the interior West. This is the last of the much-above-average heat for the upper left corner of the L48 map as the balance of the week will see more seasonable temperatures while the hotter than normal pattern persists across the interior West. The Rockies will begin to see an above normal weather pattern take shape this week as well while the Desert Southwest and portions of inland SoCal are expected to see above normal temperatures moving forward. Longer term, the models continue to favor more of a Southwest/inland hotter story heading into the final third of the month while coastal population centers remain closer to normal.
The recent heat has primed the West region for power burns, especially in the Pacific Northwest which will limit imports moving south into California. PG&E continues to battle the constraints on its system which are tied to storage already near capacity and insufficient demand to burn away the problem. This led to a series of High operational flow orders (OFOs) being declared, Monday being the third consecutive day. It should be noted that the flows tied to Gas Transmission Northwest (GTN) are reduced for today where the volume is between the derated amount at the end of May and the high point late last week. In the lower half of the state, the opposite is true as SoCalGas is looking at a new pipeline maintenance schedule for Wheeler Zone which adds five new days of reduced capacity this week and creates a tighter market which will conflict with their goal of putting more molecules into storage. Based on current flows, this will drop imports by 0.16 Bcf per day. By Wednesday the regional heat dissipates which will bring down the peak power demand and in return put downward pressure on the power burn sector. These molecules would have otherwise gone into storage, which SoCal is working hard to fill prior to the long term planned outage tied to the North Zone (L4000).
The California hydro system is quickly moving towards relying on regulated water as the warmer temperatures continue to peel off the remaining layers of higher elevation snowpack. The system operators are trying to shape as much as they can, given how the evening ramp still carries a premium value but knowing what we know about the light load period has the hydro generation chasing a 16-hour block that minimizes output during the midday block. Recent reports from the CAISO indicate that the state's installed energy storage capacity has now surpassed 10 GW. However, in May, curtailments approached a staggering 2.8M MWh, the data indicates that 2025 is projected to be over 20% higher than the previous year but the pace is slowing as we move into late spring. California renewables curtailed more power in the first four months of this year than it did in all of 2021. Now, it is unlikely that curtailments will continue at this pace, but last year’s record curtailment could be surpassed in 2025. Curtailments fall into two categories: economic system curtailments and local economic curtailments. Economic system curtailments arise from oversupply, leading to more than 2,100,000 MWh of curtailments this year. Conversely, local economic curtailments are implemented to alleviate congestion in specific areas, accounting for over 550,000 MWh of localized curtailments.
✓ 2019 965,241 MWh
✓ 2020 1,587,496 MWh
✓ 2021 1,504,803 MWh
✓ 2022 2,449,248 MWh
✓ 2023 2,659,526 MWh
✓ 2024 3,423,377 MWh
✓ 2025 2,741,671 MWh (as of May 31)


PPA Market Update Powered by LevelTen Energy
Beginning this week, we’re introducing a new section featuring U.S. PPA pricing insights sourced from LevelTen Energy. Each week, we’ll share a snapshot of current trends across renewable energy markets—highlighting average offer prices, regional movement, and key shifts in market dynamics.
These insights are designed to help you stay informed on how PPA pricing is evolving and what it may mean for your procurement strategy.
