With injection season is winding down, this week saw a reclassification of storage inventories for non-flow related adjustments that resulted in a bearish build of 63 Bcf. Regardless of the adjustment, this injection beat all market expectations ranging from 48 Bcf to 51 Bcf and matched last year’s injection for the same time frame, but still fell short of the five-year average of 77 Bcf. Inventories heading into winter will more than likely come up short of 3.2 Tcf, but a warmer-than-average winter, an anticipated El Nino event, and robust production are expected to help curb most price spikes or weather events short of another polar vortex. According to FERC’s Office of Enforcement, winter reserve margins are exceeding reference margins across the board, but fuel security and regional pipeline constraints in New York City, Boston, and Los Angeles are two issues being focused on as the colder months approach. A mostly bullish background state still seems to be the consensus for the winter ahead due to the storage deficits, but if this winter manages to have almost daily & notable swings in weather patterns as the shoulder season has so far, it could prove to be a potentially volatile withdrawal season.
Working natural gas in storage currently stands at 3,095 Bcf, which is 606 Bcf (16.4%) lower than this time last year and 624 Bcf (16.8%) lower than the five-year average.
The November 2018 NYMEX Futures price began the day around $3.19/MMBtu prior to the report’s release, but has since dropped to $3.17/MMBtu after the report was posted.

Outlook for the Balance of Storage Season:
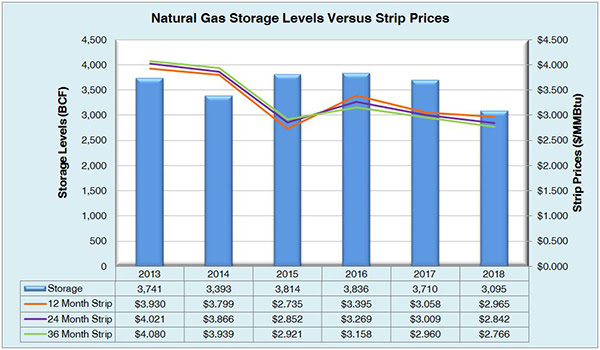
The graph below compares historical 12, 24 and 36 month strip prices and storage levels for the past 5 years.
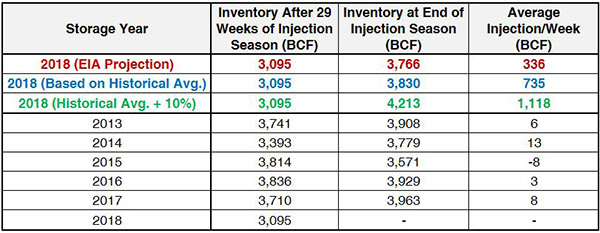
The following table shows the injection numbers we will need to average by week to hit selected historical levels:
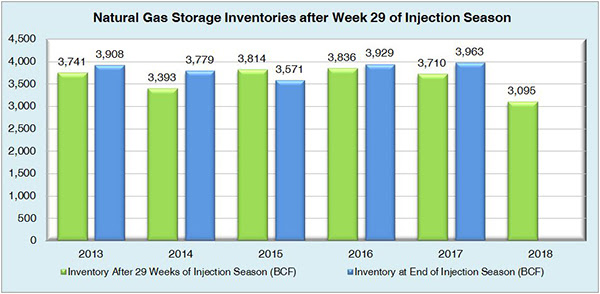
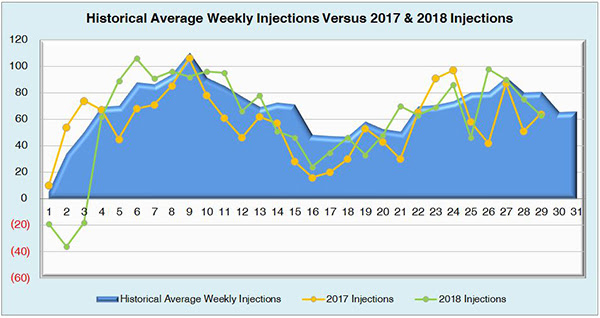
The following two graphs show current natural gas in storage compared to each of the last 5 years and weekly storage averages and patterns.
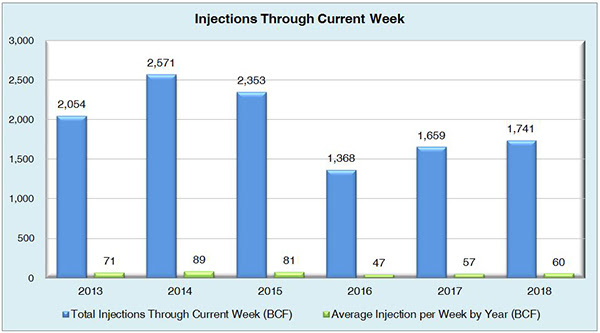
The graph below shows the injections through the current week over the past 5 years.
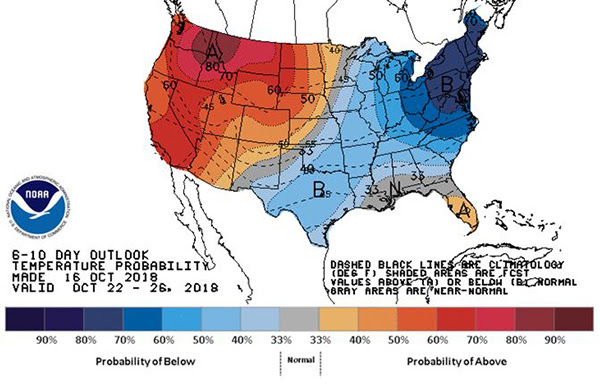
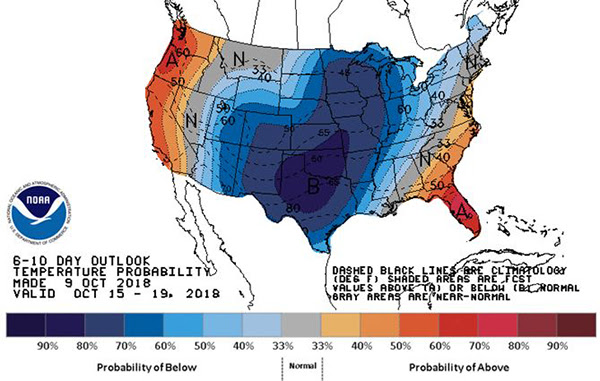
Finally, the graphics below depicts the 6 to 10 day temperature range outlook from the National Weather Service.
Current Week’s Outlook
Future Outlook