

Manufacturers are entering the fall 2026 procurement season with materially different market conditions than they faced 12 or 24 months ago. PJM’s 2026/2027 Base Residual Auction cleared at $329.17 per megawatt-day, a 22% increase from the prior year’s $269.92/MW-day result.
At the same time, New Jersey electricity costs have risen by approximately 17% to 20% in recent rate cycles, according to the New Jersey Board of Public Utilities’ 2026 investigation of PJM’s capacity market. For manufacturers operating on tight margins, the traditional question: Should the plant choose a fixed rate or an index rate?: does not adequately address the risk.
The more relevant question is: How much of the plant’s expected load should be hedged, and how much market exposure should remain available?
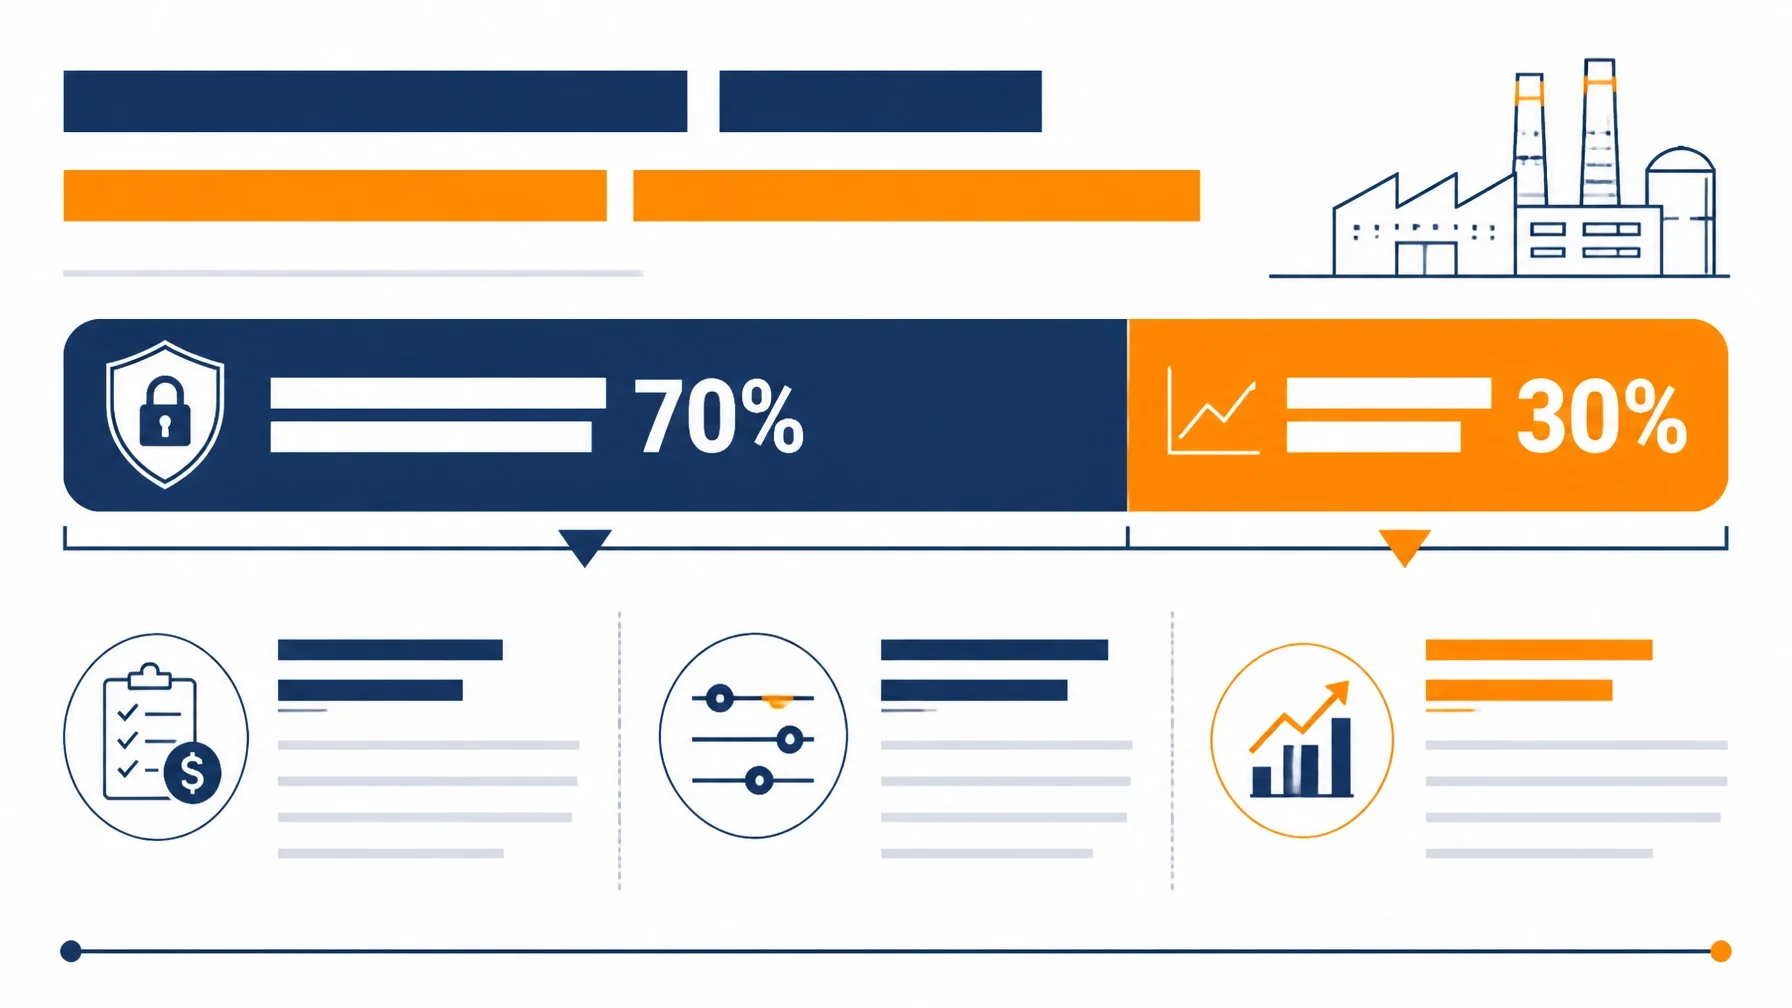
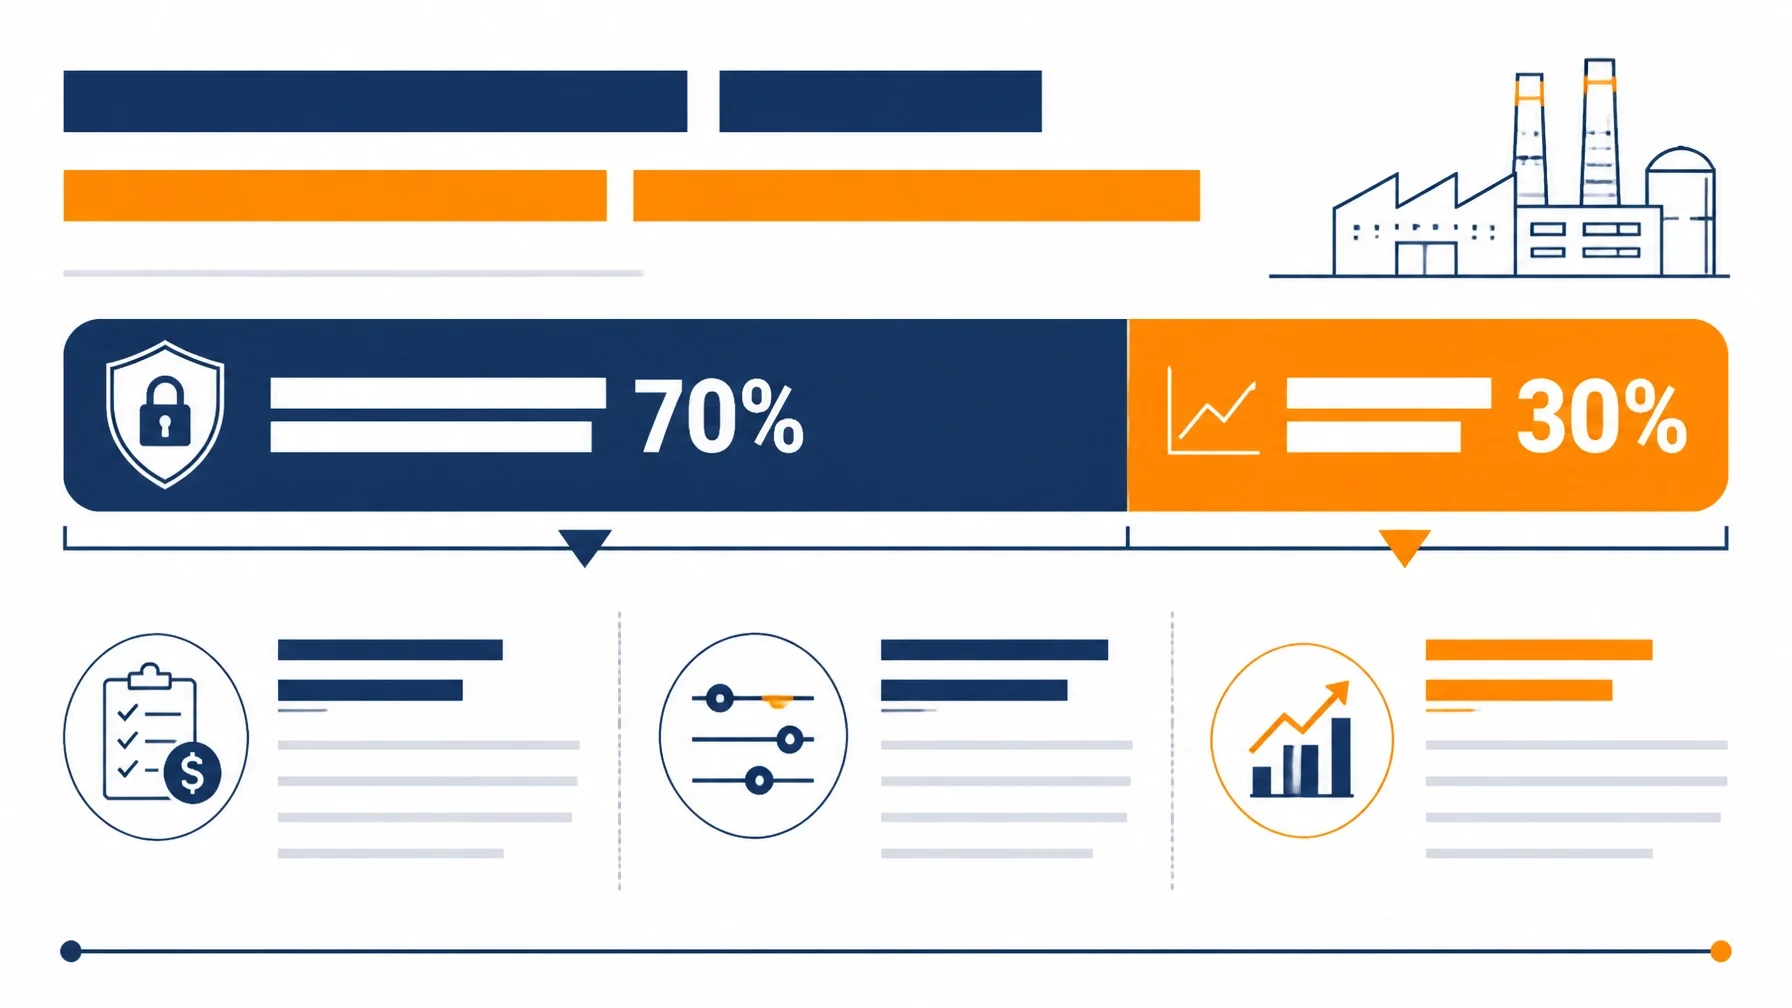
For many manufacturers, the answer is a 70/30 hybrid strategy: approximately 70% fixed and 30% indexed, adjusted according to production stability, risk tolerance, and usage data.
1. The 2026 PJM Market Has Changed the Procurement Equation
PJM’s capacity market is sending a clear signal: reliable power is becoming more expensive in a region experiencing rapid demand growth and constrained supply.
The official PJM auction announcement reports the following:
$329.17/MW-day clearing price for the 2026/2027 delivery year
$269.92/MW-day clearing price for 2025/2026
134,311 MW of generation resources and demand response procured
More than 5,400 MW of year-over-year peak-load growth
Demand growth driven by data centers, electrification, and broader economic activity
Capacity clearing at the FERC-approved price cap across the PJM footprint
The New Jersey BPU’s report places the recent price movement in a longer-term context:
2024/2025 capacity price: $28.92/MW-day
2025/2026 capacity price: $269.92/MW-day
2026/2027 capacity price: $329.17/MW-day
2027/2028 capacity price: $333.44/MW-day
2028/2029 capacity price: $325.00/MW-day
This represents a substantial change from the lower-cost environment that shaped many existing procurement policies.
For manufacturers, the implication is direct: capacity and energy risk must be evaluated together, but they should not automatically be managed in the same way.
2. Why “Fixed vs. Index” Is an Incomplete Question
A fully fixed contract and a fully indexed contract represent two ends of the risk spectrum.
A fully fixed structure
A fixed structure provides a defined energy price for the contract term. It can support:
More predictable operating budgets
Easier product-cost forecasting
Improved margin planning
Protection against energy-market spikes
Greater stability during periods of tight supply
The tradeoff is that the manufacturer may pay more than the market during lower-price periods. A fixed structure also requires accurate load forecasting. If production declines significantly, the business may be hedged above its actual consumption.
A fully indexed structure
An indexed structure allows the plant’s energy cost to move with wholesale market conditions. It can provide:
Greater participation in lower market prices
More transparent exposure to hourly or monthly market conditions
Potential benefits from flexible production schedules
Less reliance on a supplier’s long-term risk premium
The tradeoff is volatility. A plant with continuous production, limited ability to shift load, and strict annual budgeting may have difficulty absorbing sharp increases.
PJM itself estimates that the 2026/2027 capacity result could produce an average retail bill impact of approximately 1.5% to 5%, depending on how costs are reflected in customer rates. However, market analysts have identified potential 10% to 20% increases for more exposed commercial and industrial customers, particularly where procurement structures leave greater market sensitivity.
The difference between those estimates reflects the importance of the individual customer profile. A large manufacturer with high peak demand does not experience the market in the same way as a small commercial account.
3. The 70/30 Hybrid Creates a More Practical Risk Profile
A 70/30 hybrid strategy fixes approximately 70% of expected usage while leaving 30% exposed to the index. The precise allocation can range from 50% to 70% fixed and 30% to 50% indexed, depending on operational conditions.
The strategy is designed to balance three objectives:
Protect the operating budget
Retain some access to lower market prices
Avoid making a single all-or-nothing market forecast
For a manufacturer with stable production, the fixed portion can cover consistent baseload operations. The indexed portion can remain available for variable production, seasonal changes, or usage that is more difficult to forecast.
A 70/30 strategy can also reduce the consequences of being wrong. If energy prices rise, most of the load has protection. If prices decline, 30% of usage can benefit from the lower market. The structure does not eliminate risk, but it distributes risk more deliberately.
This is why hybrid procurement is increasingly becoming the practical industry consensus for energy-intensive businesses. Manufacturers are not required to choose between total certainty and total exposure when the contract can be designed around both.
4. The Correct Fixed-to-Index Ratio Depends on Plant Data
The 70/30 model is a starting point, not a universal formula. The correct allocation depends on measurable operating characteristics.
A manufacturer may consider a higher fixed percentage when:
Monthly energy costs must remain within a narrow budget range
Production runs continuously or follows a predictable schedule
Energy represents one of the plant’s top three operating expenses
Product pricing is established months in advance
A 10% to 20% increase would materially affect margins
The facility has limited ability to shift production during high-price periods
A manufacturer may consider a larger indexed portion when:
Production volume changes substantially from month to month
The plant can shift flexible processes to lower-cost hours
Management has a higher tolerance for monthly bill variation
Energy costs can be adjusted through product pricing
The facility has active demand management capabilities
Expansion or contraction makes future load uncertain
The analysis should include at least:
Twelve to thirty-six months of interval usage
Seasonal load changes
Peak demand behavior
Production schedules and planned expansions
Historical monthly cost variation
Budget thresholds for adverse market scenarios
The operational value of load flexibility
A manufacturer should not select a percentage based solely on a headline rate. The rate must be evaluated against the plant’s actual load shape and financial objectives.
5. Fall 2026 Is the Time to Model the Decision
The procurement window from September through November 2026 is an important period for manufacturers reviewing upcoming supply contracts. Waiting until renewal is imminent can reduce strategic flexibility and limit the ability to compare structures.
The analysis should model at least three scenarios:
Scenario 1: Fully fixed
This scenario measures the cost of maximum budget protection. It establishes the premium associated with reducing market exposure.
Scenario 2: Fully indexed
This scenario measures the potential benefit and downside of complete market participation. It should include both moderate and stressed market assumptions.
Scenario 3: 70/30 hybrid
This scenario measures the effect of fixing the majority of expected load while retaining a defined market position.
The comparison should evaluate:
Estimated annual cost
Monthly cost range
Best-case and worst-case exposure
Budget variance
Impact of production changes
Sensitivity to energy-market movement
Capacity treatment under each offer
Contract duration and renewal timing

The best structure is the one that fits the plant’s financial and operational profile: not necessarily the one with the lowest initial quoted rate.
6. Energy Management Must Support the Procurement Strategy
A contract structure addresses price risk, but usage behavior determines how much energy the facility buys and when it buys it.
Manufacturers should monitor:
Unexpected increases in equipment consumption
Production-line energy intensity
Demand peaks during PJM coincident peak periods
Seasonal changes in operating efficiency
Metering inconsistencies
Utility-bill anomalies
Consumption differences between facilities
United Energy Consultants provides Energy Tracker Pro, a cloud-based utility management platform designed to help businesses monitor energy cost and consumption across locations and devices.
The platform can support procurement decisions by helping identify:
Actual baseload consumption
Load volatility
High-consumption equipment
Potential billing discrepancies
Opportunities to reduce peak usage
Changes that may affect the fixed-to-index allocation
This creates a feedback loop between procurement and operations. The contract reflects the usage data, while the usage data helps refine the next procurement decision.
7. UEC Uses an Independent, Data-Driven Approach
United Energy Consultants does not approach manufacturers with a predetermined supplier or one-size-fits-all product. UEC is completely independent, has no supplier affiliations, and works across deregulated states.
The company develops custom buying strategies using:
Historical usage data
Facility operating requirements
Production forecasts
Market conditions
Budget objectives
Risk tolerance
Supplier competition
With more than 20 years of experience and strong wholesale energy relationships, UEC evaluates multiple procurement structures rather than reducing the decision to fixed versus index.
UEC also operates with zero out-of-pocket costs for clients. The goal is to help the manufacturer secure a competitive supply strategy while improving visibility into ongoing energy performance.
8. Build the Strategy Before the Market Builds It for You
The 2026 market does not support passive procurement. PJM capacity prices have reached record levels, New Jersey businesses are confronting significant cost increases, and market reforms remain under discussion.
For many manufacturers, the most defensible approach is to:
Fix approximately 50% to 70% of expected load
Leave approximately 30% to 50% indexed
Adjust the ratio using actual usage and production data
Test the strategy against multiple market scenarios
Monitor performance through an ongoing energy-management system
A 70/30 hybrid is not a guarantee of lower costs. It is a structured method for balancing budget protection and market participation in an uncertain environment.
Contact United Energy Consultants before finalizing a fall 2026 procurement decision. UEC can review the facility’s usage data, compare fixed, indexed, and hybrid strategies, and build a custom buying plan with zero out-of-pocket costs. Learn more about how UEC works or explore Energy Tracker Pro to improve visibility into utility costs and consumption.