Despite being on the slightly bullish side with a 4 Bcf reclassification, the first build of injection season reported a net change of 25 Bcf that isn’t expected to shake anything up as we soldier on into the shoulder months. Rangebound trading has continued for the past few weeks and could even trend downward into summer as, according to EIA, “Continuing domestic natural gas production growth will exert downward pressure on prices through next year resulting in Henry Hub natural gas prices averaging $2.82/MMBtu for 2019 and $2.77/MMBtu in 2020.” Considering the Permian Basin is stacking up even more natural gas inventories through associated gas methods lately, upward movement on NYMEX futures, at least for the short term, seem to have an unofficial ceiling at $3/MMBtu. Mixed weather fundamentals are having a muted effect on futures as well, and the NOAA seasonal climate forecast for summer is providing a much more manageable June-August picture that could see less cooling demand than last year. While coal-fired generation is expected to retire around 5.4 GW nationwide through August 2019, 13.9 Gw of gas-fired generation should be coming online during the same timeframe. Storage inventories may be at their lowest since 2003 (with the exception of winter 2013/2014 due to the polar vortex) and are facing challenges at replenishing, the incessant record-setting production that should be exceeding 90 Bcf/d this year will certainly aid the effort in eliminating the deficit.
Working natural gas in storage currently stands at 1,155 Bcf, which is 183 Bcf (13.7%) lower than this time last year and 485 Bcf (29.6%) lower than the five-year average.
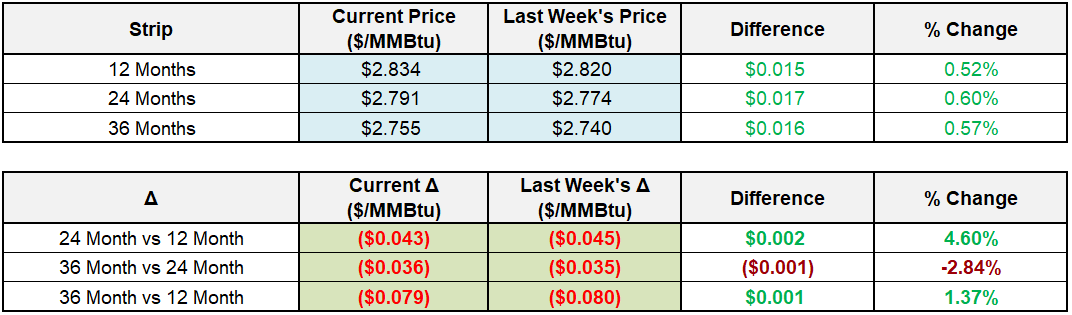
The May 2019 NYMEX Futures price began the day around $2.69/MMBtu prior to the report’s release and has remained flat after the report was posted.
Outlook for the Balance of Storage Season:
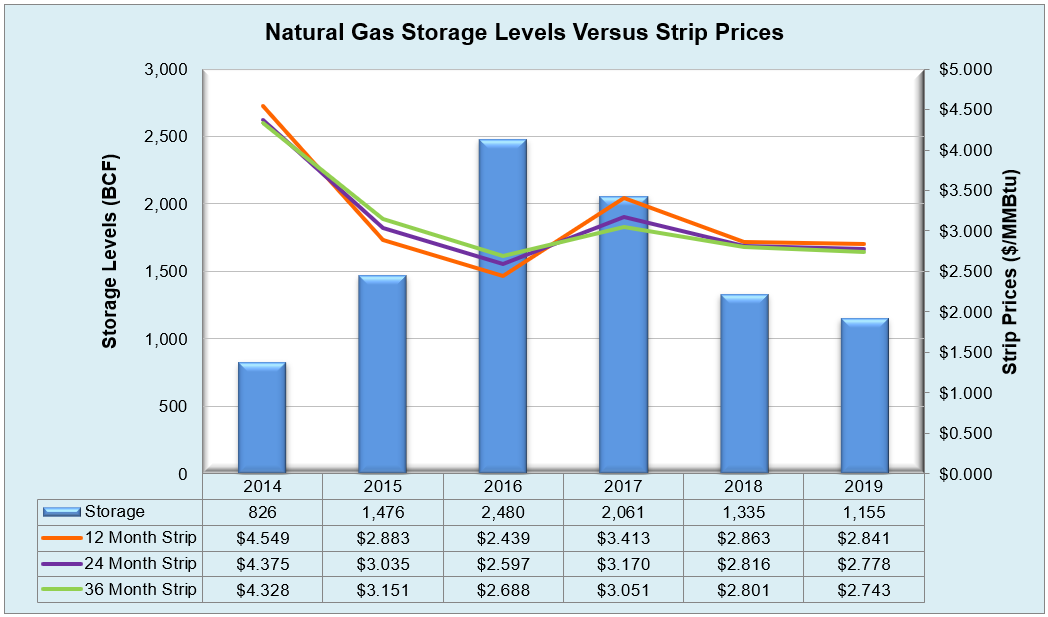
The graph below compares historical 12, 24 and 36 month strip prices and storage levels for the past 5 years.
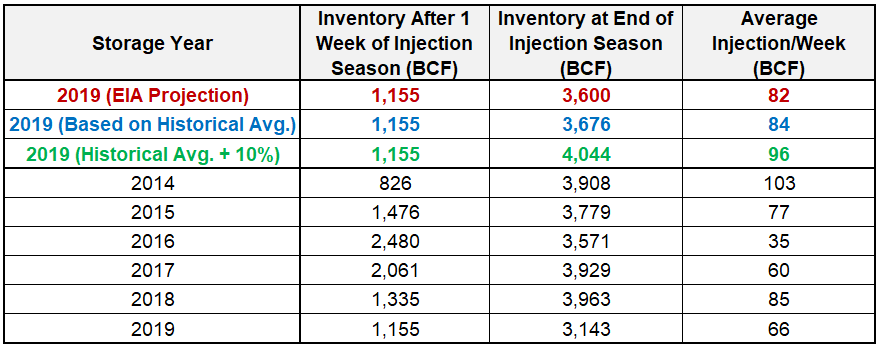
The following table shows the injection numbers we will need to average by week to hit selected historical levels:
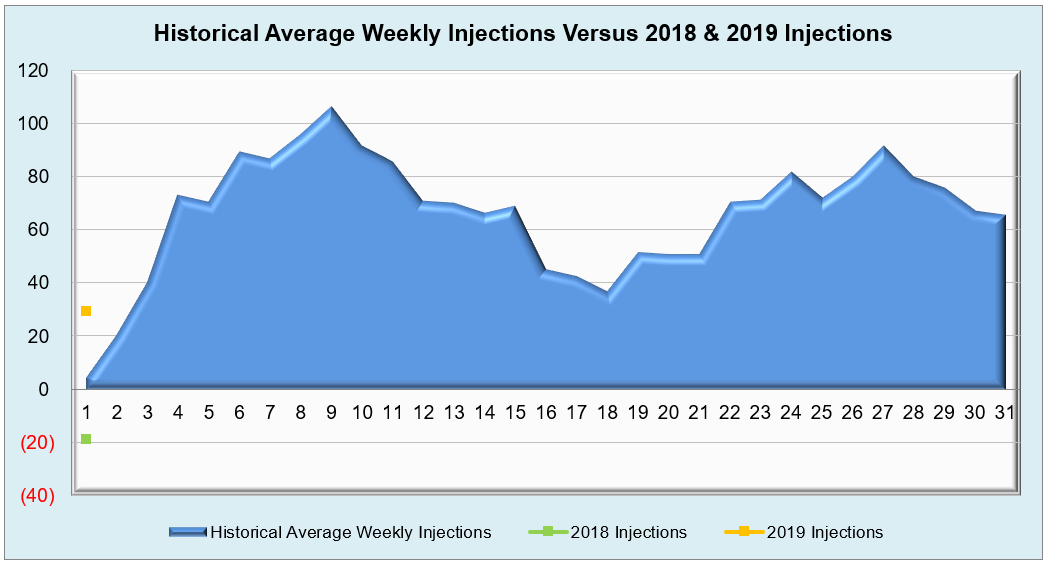
The following two graphs show current natural gas in storage compared to each of the last 5 years and weekly storage averages and patterns.

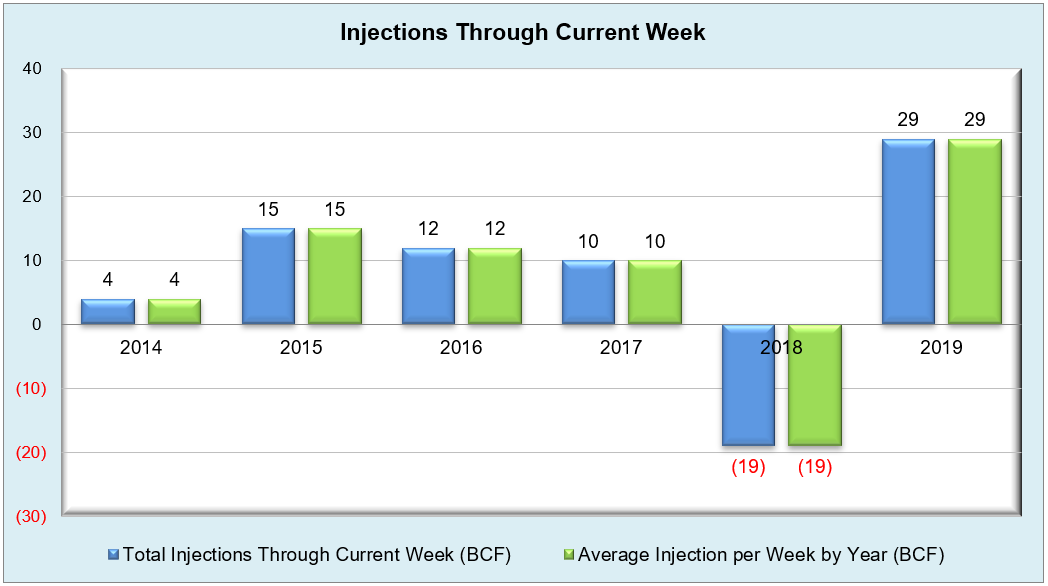
The graph below shows the injections through the current week over the past 5 years.
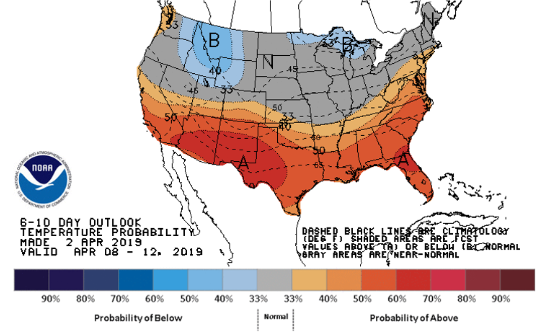
Finally, the graphics below depicts the 6 to 10 day temperature range outlook from the National Weather Service.
Current Week’s Outlook

Future Outlook