After seven weeks in a row of triple-digit injections, one could say that NYMEX futures are looking slightly bearish as of late. The recent EIA report provided an injection of 115 Bcf that exceeded expectations, last year’s 95 Bcf build, and the five-year average of 84 Bcf. The deficit against the five-year average storage inventories has also finally shrunk under 200 Bcf as of this week, and the end of season predicated levels are coming in strong around 3.6 Tcf to 3.75 Tcf for withdrawal season. Fundamental catalysts for this larger than expected injection were driven largely by cooler weather across most of the U.S., with the notable exception of the West coast and deep Southern regions, and forecast systems noting losses of a couple of cooling degree days. The 12 month strip prices continues to tumble due to the absence of sustained warmer weather, and that has shifted the background picture of the market from backwardated to contango over the past few weeks. Shorter terms are looking strong and major hub index power prices continue to stay subdued as well. More than likely, normal gas weighted degree days are in the forecast once the beginning of July rolls around, but the bears are certainly still in control as support prices continue to be broken and settled under.
Working natural gas in storage currently stands at 2,203 Bcf, which is 209 Bcf (10.5%) higher than this time last year and 199 Bcf (-8.35%) lower than the five-year average.
The July 2019 NYMEX Futures price began the day around $2.28/MMBtu prior to the report’s release and dropped to $2.22/MMBtu after the report was posted.
Outlook for the Balance of Storage Season:
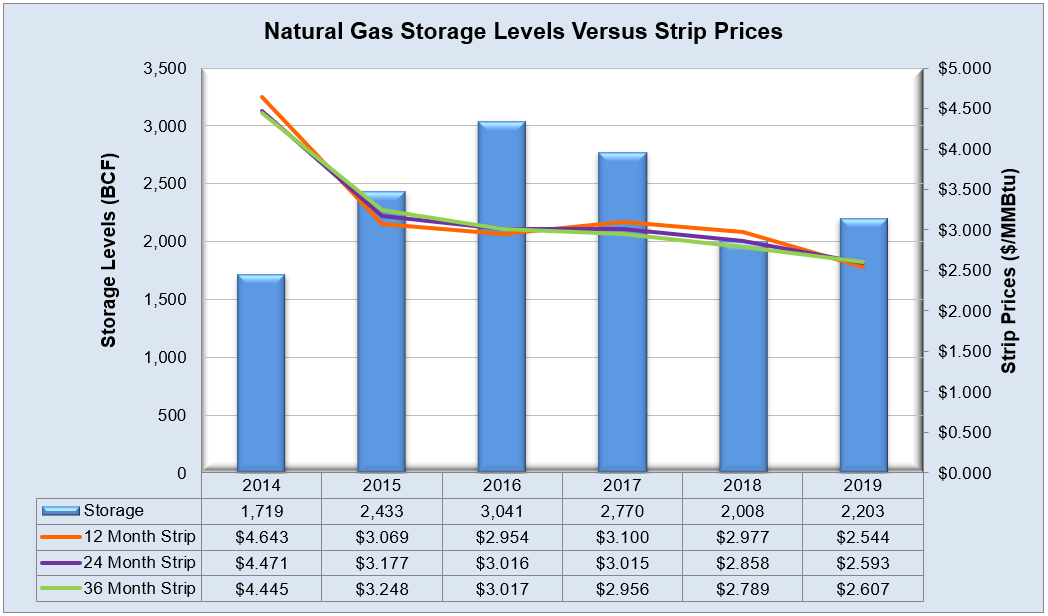
The graph below compares historical 12, 24 and 36 month strip prices and storage levels for the past 5 years.
The following table shows the injection numbers we will need to average by week to hit selected historical levels:

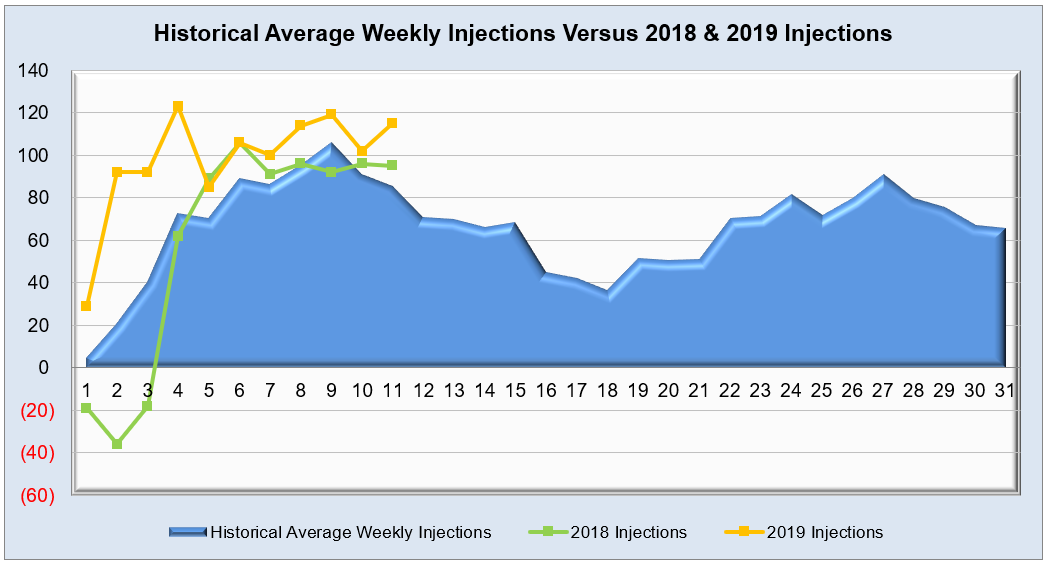
The following two graphs show current natural gas in storage compared to each of the last 5 years and weekly storage averages and patterns.
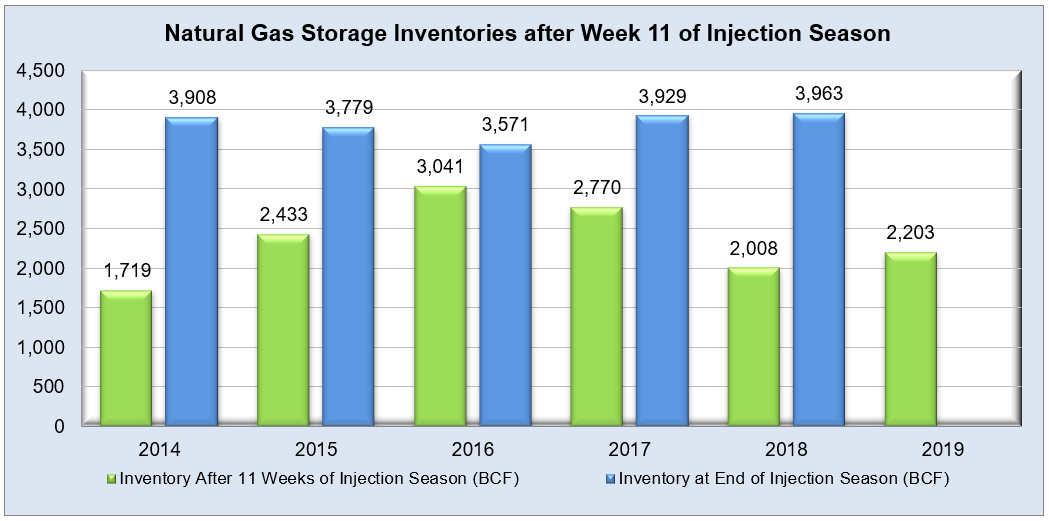
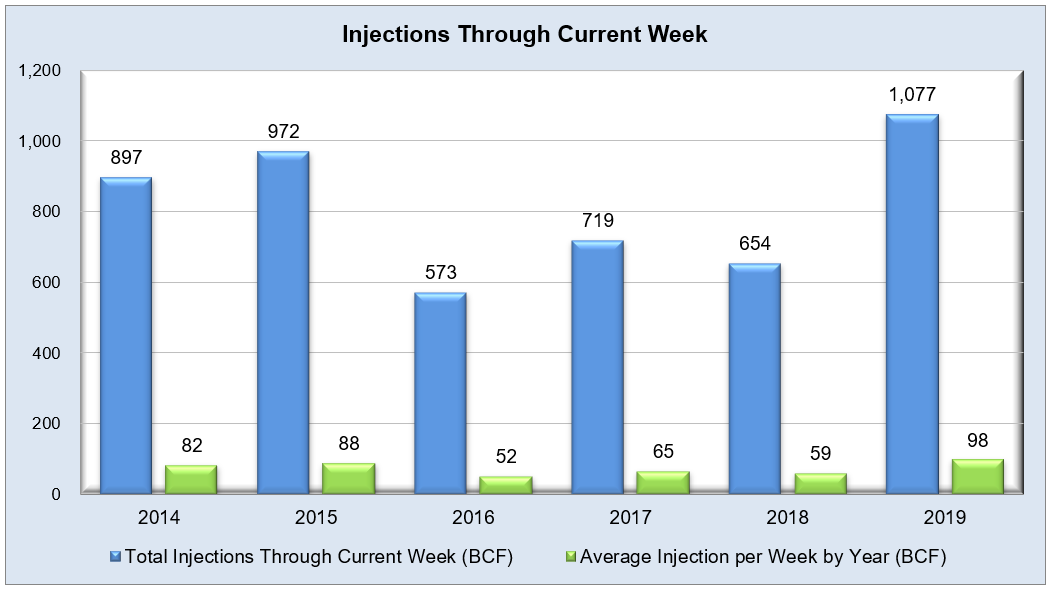
The graph below shows the injections through the current week over the past 5 years.
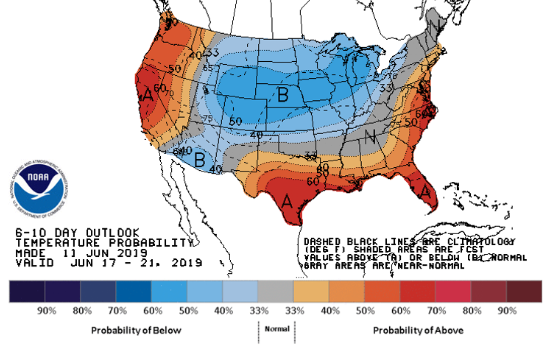
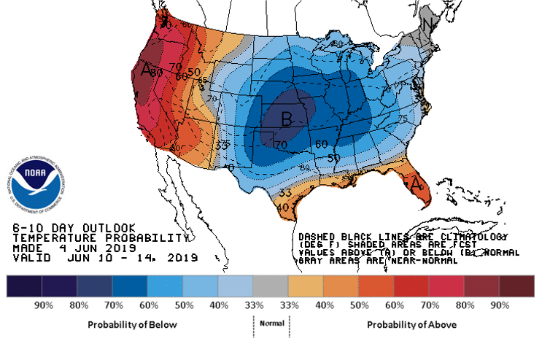
Finally, the graphics below depicts the 6 to 10 day temperature range outlook from the National Weather Service.
Current Week’s Outlook
Future Outlook