The streak of triple-digit injections has finally been broken with a build of 98 Bcf, but it still ended up matching market expectations while surpassing last year’s value of 71 Bcf amd the five-year average of 70 Bcf. Warmer than normal temperatures along the West coast, the deeper Southern region, and part of the East certainly aided in this very slightly bullish but mostly flat print, yet a swath of cooler weather made its way across the majority of the interior U.S. Demand made some strides during the reporting period per Genscape, as “the increases were driven by power burns, along with exports to Mexico and via liquified natural gas facilities.” Despite this noted increase, the consensus for end of season storage inventories continues to sit around the 3.7 Tcf level, which is well within the five-year average range. At an ISO level, ERCOT continues to work with minimal reserve margin that may not be tested if sustained heat cannot stick around, and NYISO’s proposed carbon pricing plans have flipped the calendar strip prices in multiple zones to contango. On a similar note, NYMEX strip prices have also flipped to contango over the past few weeks, causing the 12 month strip to show more favor than longer terms. Real time daily index prices at major hubs continue to be muted, yet an uptick could be on the horizon, particularly at ERCOT Houston and North. Summer could finally show up between Weeks 14 to 16 of injection season, but July’s initial heat isn’t expected to stick at the moment.
Working natural gas in storage currently stands at 2,301 Bcf, which is 236 Bcf (11.4%) higher than this time last year and 171 Bcf (-6.9%) lower than the five-year average.
The August 2019 NYMEX Futures price began the day around $2.27/MMBtu prior to the report’s release and increased to $2.32/MMBtu after the report was posted.

Outlook for the Balance of Storage Season:
The graph below compares historical 12, 24 and 36 month strip prices and storage levels for the past 5 years.

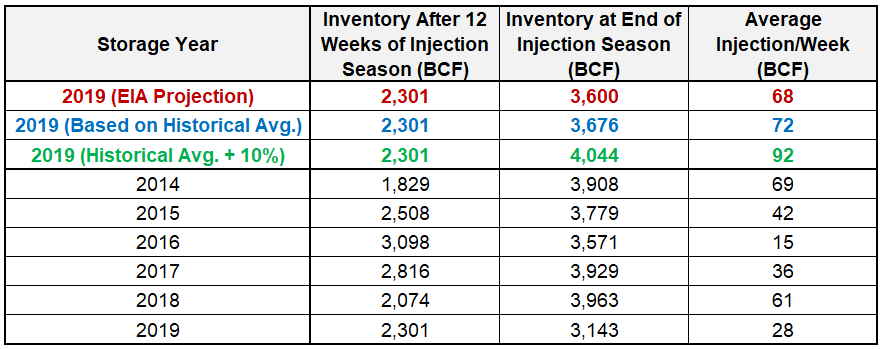
The following table shows the injection numbers we will need to average by week to hit selected historical levels:
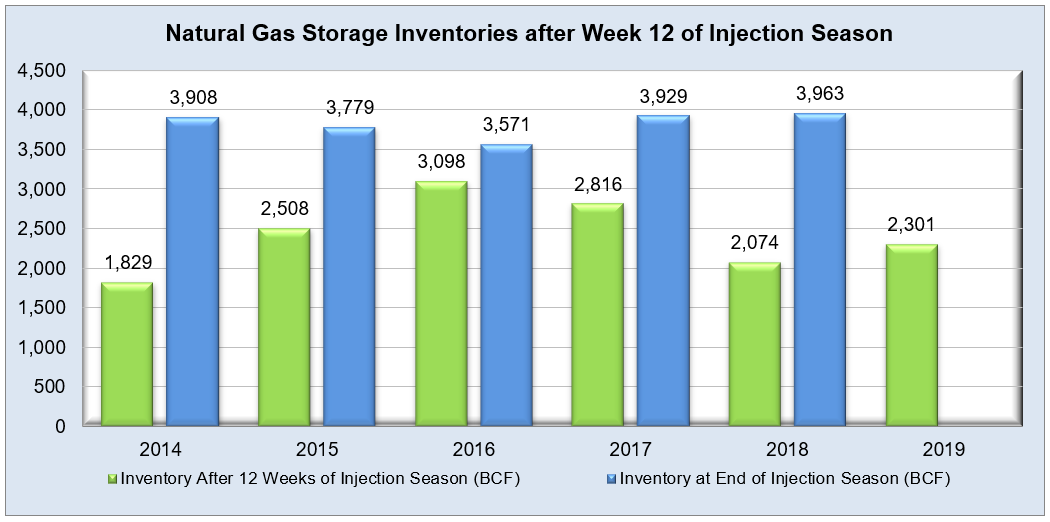
The following two graphs show current natural gas in storage compared to each of the last 5 years and weekly storage averages and patterns.
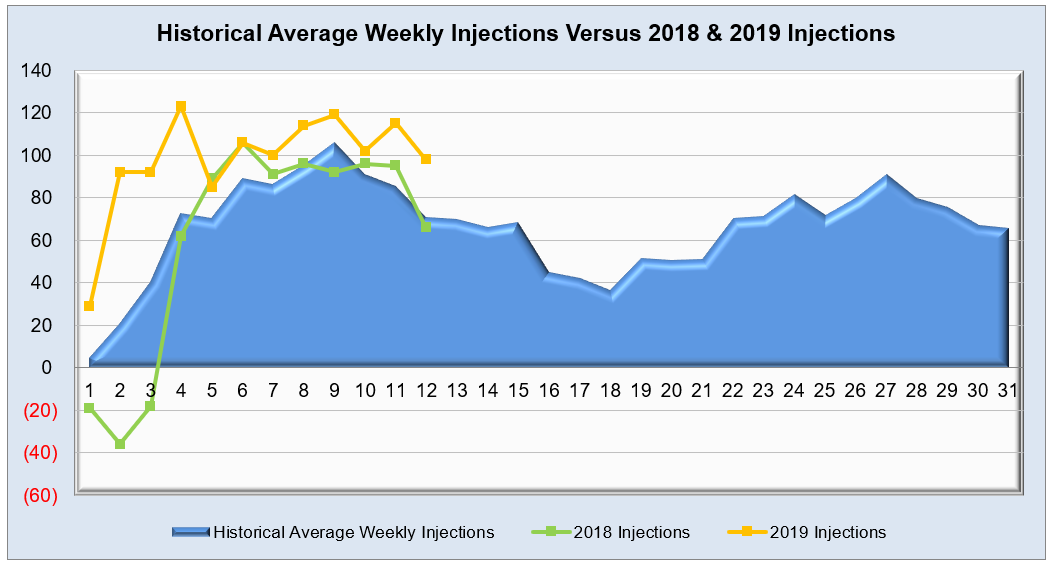
The graph below shows the injections through the current week over the past 5 years.

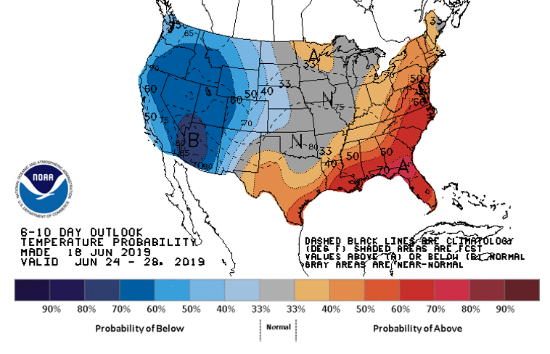
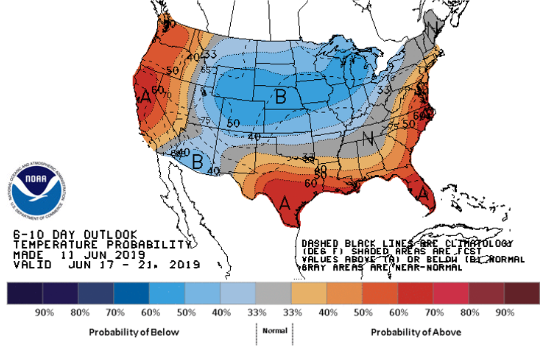
Finally, the graphics below depicts the 6 to 10 day temperature range outlook from the National Weather Service.
Current Week’s Outlook
Future Outlook