Even with impending tropical storms, the July 4
th holiday weekend, and summer heat finally making an appearance, this week’s storage build of 81 Bcf still exceeded market expectations, last year’s 55 Bcf injection, and the five-year average of 71 Bcf. While last week offered little in the realm of fundamental factors besides a mixed forecast, this week’s introduction of tropical storm Barry already has some offshore production shuttered as it approaches. The always difficult to nail down balance of production cuts and demand destruction will be a key aspect to watch as the storm is expected to cover the majority of Louisiana, a major location for LNG terminals and facilities. As for the remainder of the Lower 48, the Northeast is also currently seeing some precipitation that is forecast to deter some warmer weather seen earlier this week, but this current mix of fundamental factors will mostly be hinging on the state of onshore refineries in Louisiana and their ability to weather the incipient storm. Major power hub prices continue to be muted across the board save for a small jump on July 3
rd in ERCOT, but nothing notable or sustained. Speaking of sustained activity, any prolonged rain or storm surge due to Barry will be important to note over the weekend as well.
Working natural gas in storage currently stands at 2,471 Bcf, which is 275 Bcf (12.5%) higher than this time last year and 142 Bcf (-5.4%) lower than the five-year average.
The August 2019 NYMEX Futures price began the day around $2.44/MMBtu prior to the report’s release and increased to $2.47/MMBtu after the report was posted.
Outlook for the Balance of Storage Season:
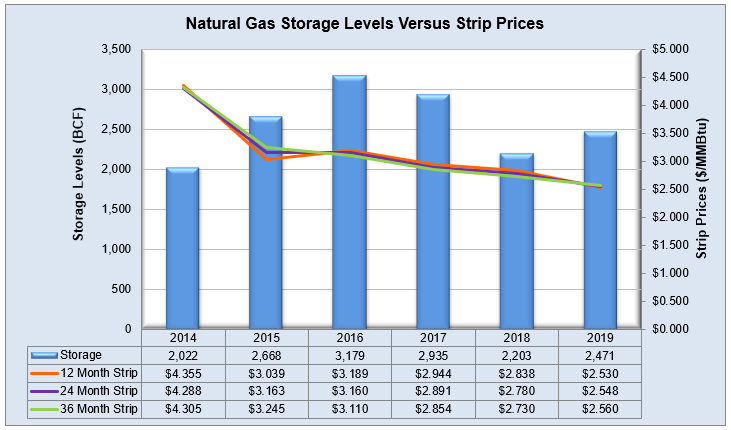
The graph below compares historical 12, 24 and 36 month strip prices and storage levels for the past 5 years.
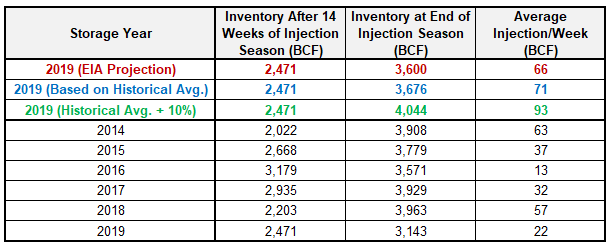
The following table shows the injection numbers we will need to average by week to hit selected historical levels:
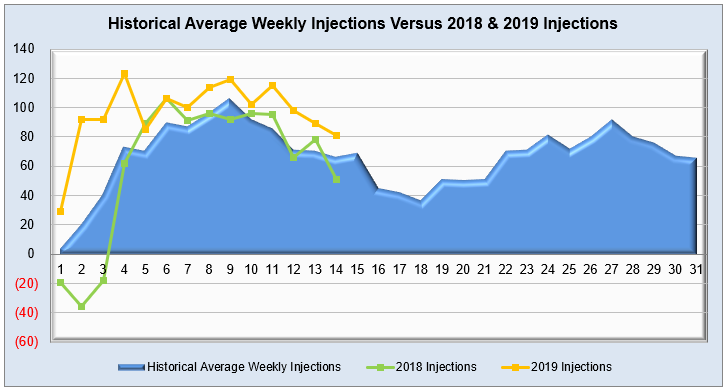
The following two graphs show current natural gas in storage compared to each of the last 5 years and weekly storage averages and patterns.

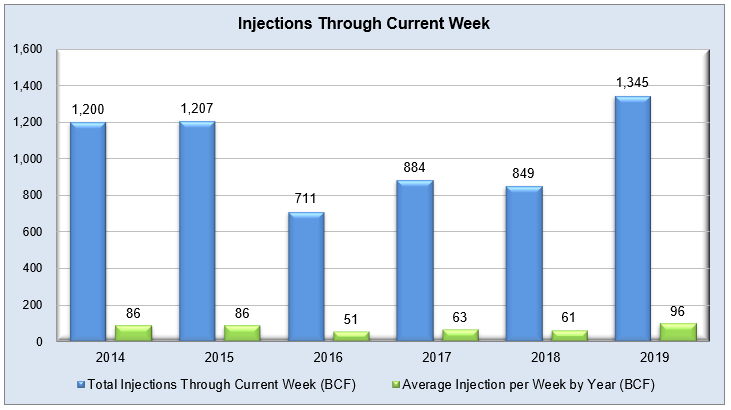
The graph below shows the injections through the current week over the past 5 years.
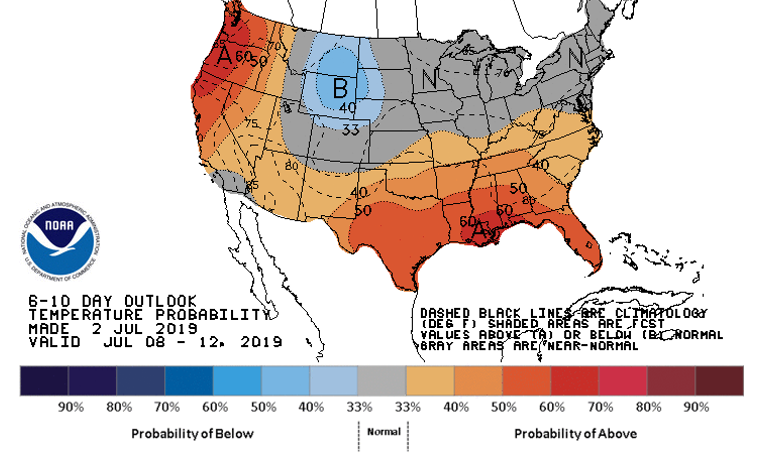
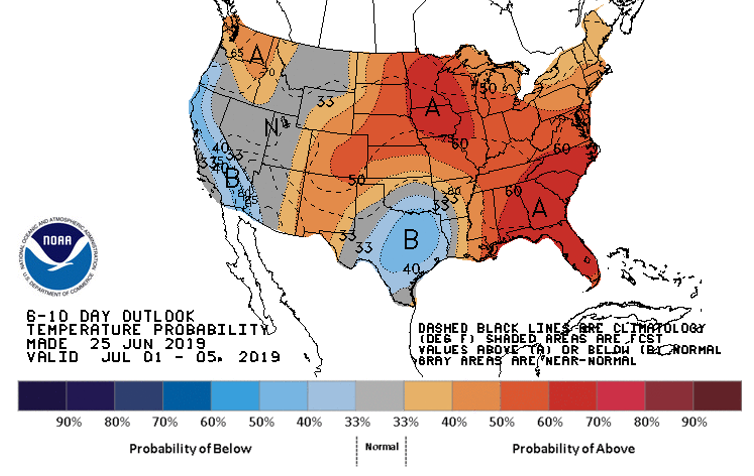
Finally, the graphics below depicts the 6 to 10 day temperature range outlook from the National Weather Service.
Current Week’s Outlook
Future Outlook