Despite this week’s 36 Bcf injection being the second smallest build of the season, the background state of the market continues to remain neutral to bearish. Storage inventories are heading steadily closer to the five-year average, and while this build fell short of the 44 Bcf five-year average for the same time period, it managed to exceed last year’s 27 Bcf injection. The effects of Tropical storm Barry on production have dwindled, but the Gulf of Mexico isn’t quite back in full force. In other fundamental news, the notable heatwave that washed over NYISO and parts of PJM right after the reporting period clearly wasn’t enough to inspire bulls to move the needle on NYMEX futures in an upward trajectory. In fact, depending on where the August contract month ends up settling, the market could be realizing an almost twenty year low for average natural gas spot prices, according to the EIA. On the other hand, he Pacific region’s contributions to storage inventories could become muted going forward due to the California PUC approving the Aliso Canyon storage facility to be used to curb volatility in natural gas pricing for CAISO. That region is one of the lesser contributors to storage overall, so it may not be a drastic change, but a few Bcf in the wrong direction could make a difference regardless. As for power, real time index rates for the six major hubs we currently follow continue to be mostly calm, but NYISO will certainly see a short spike due to the heat that the ISO experienced over the weekend following the reporting period. The little hope bulls had for a rally due to above normal weather seems to be almost diminished for the time being, even as the already weak El Nino is looking to fade away over the course of the shoulder season head.
Working natural gas in storage currently stands at 2,569 Bcf, which is 300 Bcf (13.2%) higher than this time last year and 151 Bcf (-5.6%) lower than the five-year average.
The August 2019 NYMEX Futures price began the day around $2.23/MMBtu prior to the report’s release and remained flat after the report was posted.
Outlook for the Balance of Storage Season:
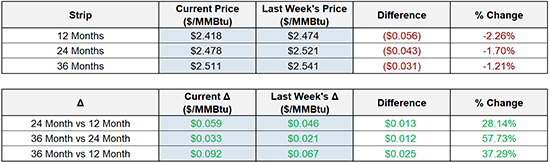
The graph below compares historical 12, 24 and 36 month strip prices and storage levels for the past 5 years.

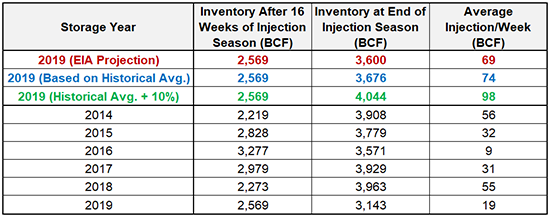
The following table shows the injection numbers we will need to average by week to hit selected historical levels:
The following two graphs show current natural gas in storage compared to each of the last 5 years and weekly storage averages and patterns.

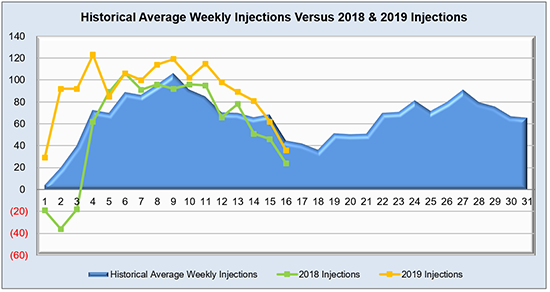
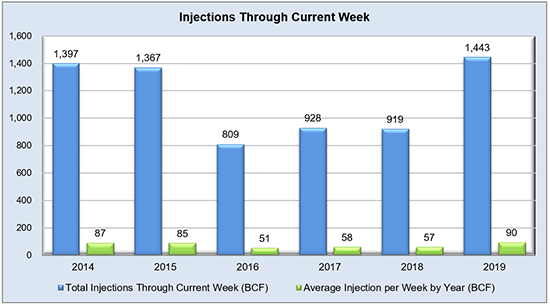
The graph below shows the injections through the current week over the past 5 years.
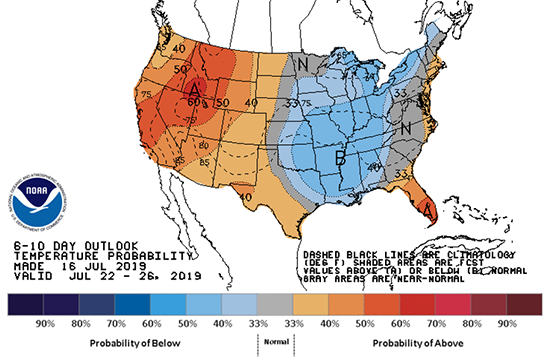
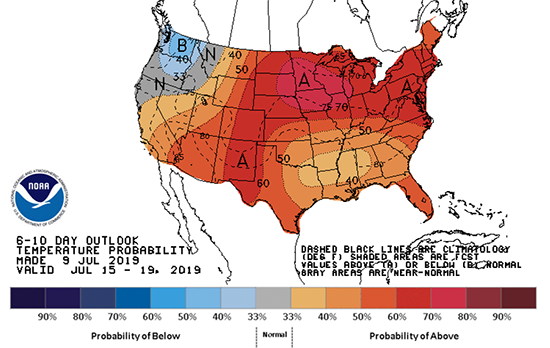
Finally, the graphics below depicts the 6 to 10 day temperature range outlook from the National Weather Service.
Current Week’s Outlook
Future Outlook