NYMEX may be a tad oversold at the moment, but the normal to below-normal temperatures in key demand regions have resulted in yet another bearish injection into storage. The current week’s build of 65 Bcf flew past all market expectations and more than doubled last year’s injection and the five-year average for the same time period, which came in at 31 Bcf and 37 Bcf respectively. The Pacific region ended up with a withdrawal due to the heat that stuck around in that particular region, but the Northeast and Midwest saw relief after a brief hot spell that preceded this week’s reporting period. Storage influence aside, NYMEX is turning more toward technical factors with the weather expected to be mostly unresponsive until mid-August. Real time index power prices saw a slight uptick in NYISO and ISO-NE due to the July heat wave, but little other movement has occurred in that regard. Even in the face of recent short covering, an increase in power burns, and the continued build out of LNG terminals, the background state of the market still remains mostly bearish. Any sort of major heat patterns that crop up in the last remaining month or so of summer is not expected to be sustained, so the market will be looking to winter sooner than later.
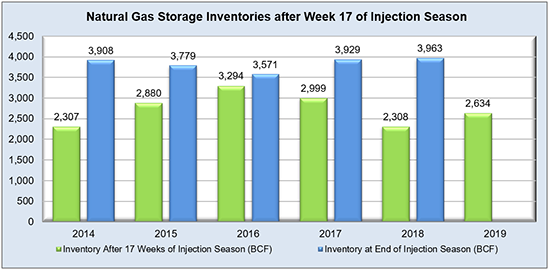
Working natural gas in storage currently stands at 2,634 Bcf, which is 334 Bcf (14.5%) higher than this time last year and 123 Bcf (-4.5%) lower than the five-year average.
The September 2019 NYMEX Futures price began the day around $2.24/MMBtu prior to the report’s release and decreased to $2.23/MMBtu after the report was posted.
Outlook for the Balance of Storage Season:
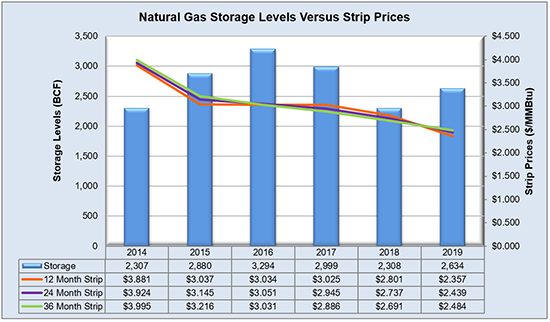
The graph below compares historical 12, 24 and 36 month strip prices and storage levels for the past 5 years.
The following table shows the injection numbers we will need to average by week to hit selected historical levels:

The following two graphs show current natural gas in storage compared to each of the last 5 years and weekly storage averages and patterns.
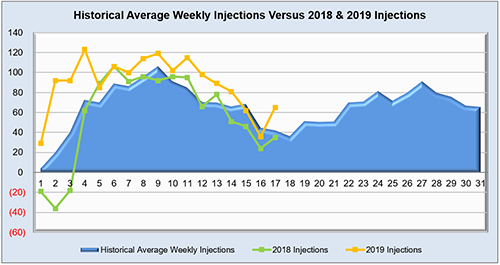
The graph below shows the injections through the current week over the past 5 years.

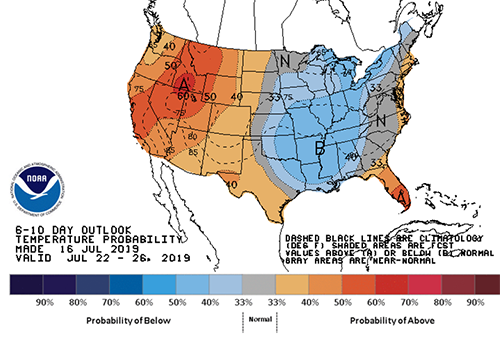
Finally, the graphics below depicts the 6 to 10 day temperature range outlook from the National Weather Service.
Current Week’s Outlook
Future Outlook
