Bearish sentiments are out in full force as this week’s build of 92 Bcf not only trounced last year’s withdrawal of 34 Bcf and the five-year average injection of 21 Bcf, but also is running in tandem with decreases in LNG exports, pipeline exports to Mexico, and unremarkable weather patterns that aren’t leaning toward either heating or cooling degree days. After breaking a major support level of $2.522/MMBtu, NMEX prompt month futures continued to slip to the $2.50/MMBtu level, and with more (potentially triple-digit) large injections in the forecast, it doesn’t seem the market willing be leaving its current rangebound status until cooling degree days decide to increase with summer around the corner. The only respite NYMEX may have from further downward trends is a fair amount of maintenance occurring on a few major pipelines and shale plays (which is common during shoulder seasons due to less volatility), but once these operations are complete, production is expected ramp back up to a range between 86 Bcf/d and 90 Bcf/d. Cooling demand should offset this downward pressure, but a cooler and wetter summer than last year and a weak to possible moderate El Nino is expected per NOAA, bringing into question how much power demand will be affected. It’s a bit early for a clear picture of summer’s potential effects, but the next couple of months will see quite a few large injections that will aid in tightening up the market and closing the large deficit that was created against the five-year average last year.
Working natural gas in storage currently stands at 1,247 Bcf, which is 57 Bcf (4.4%) lower than this time last year and 414 Bcf (24.9%) lower than the five-year average.
The May 2019 NYMEX Futures price began the day around $2.50/MMBtu prior to the report’s release and increased to $2.52/MMBtu after the report was posted.

Outlook for the Balance of Storage Season:
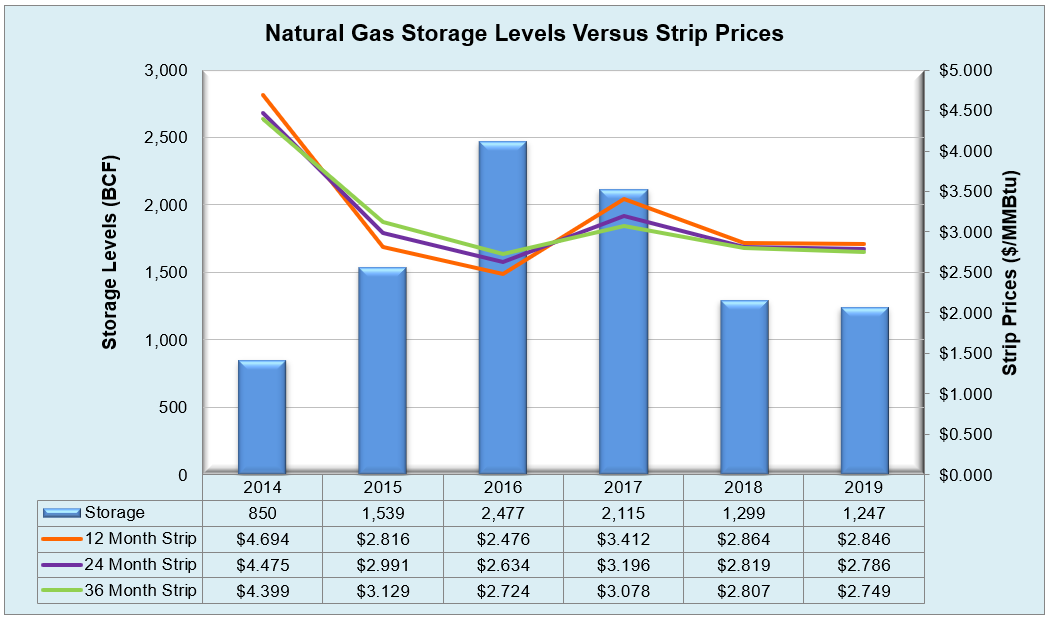
The graph below compares historical 12, 24 and 36 month strip prices and storage levels for the past 5 years.
The following table shows the injection numbers we will need to average by week to hit selected historical levels:

The following two graphs show current natural gas in storage compared to each of the last 5 years and weekly storage averages and patterns.

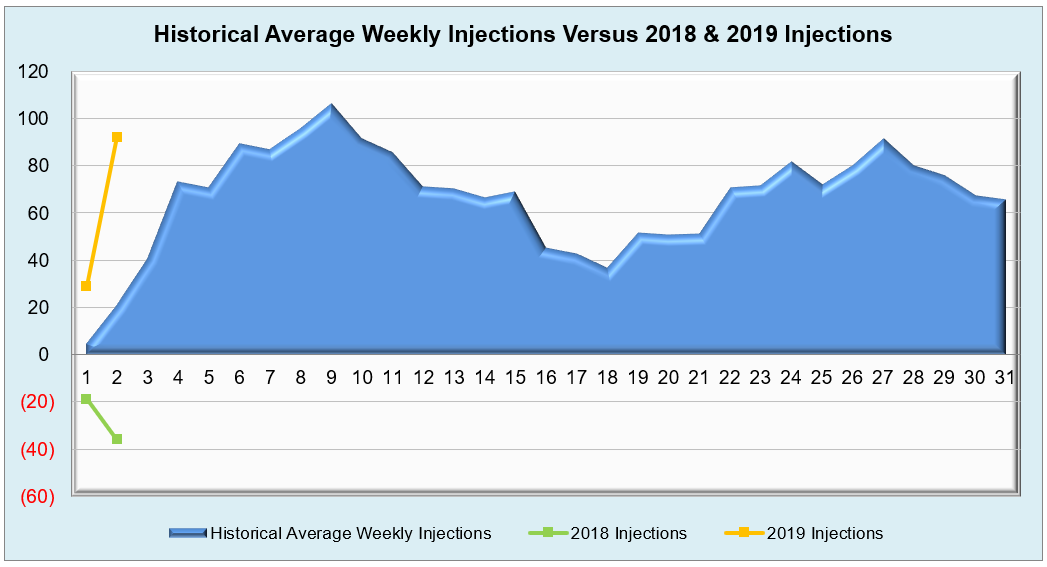
The graph below shows the injections through the current week over the past 5 years.

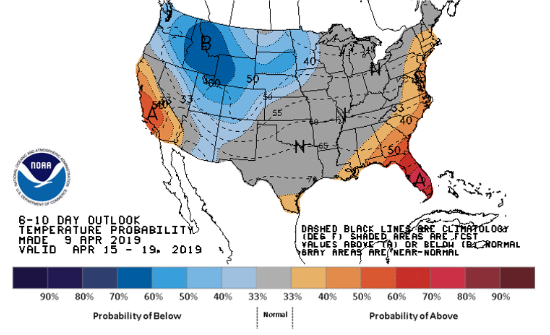
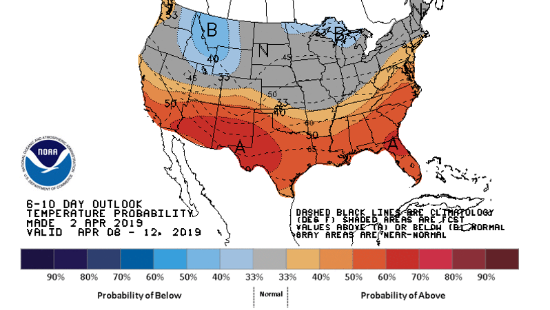
Finally, the graphics below depicts the 6 to 10 day temperature range outlook from the National Weather Service.
Current Week’s Outlook
Future Outlook