Week 2 of injection season saw another withdrawal of 36 Bcf, which was higher than the expectation of 23 Bcf. Last year we saw an injection of 47 Bcf and the five year average stands at 38 Bcf. Today’s withdrawal was way above the expectations of many traders which were in the range of 7-30 Bcf. The largest withdrawal came from the Midwest region which had a net withdrawal of 18 Bcf. Unusual cold weather is still lingering and the withdrawals are making the market slightly bullish, but not enough to make a strong reaction to drastically see any increases in price. Recent projections made by organizations like the International Energy Agency state the that United States is going to be the largest LNG exporter by the mid 2020’s, so this could increase future demand and make the market more bullish.
Current working natural gas inventories stands at 1,299 Bcf. This figure is 808 Bcf (38.3%) less than this time last year and 449 Bcf (25.7%) below the five year average.
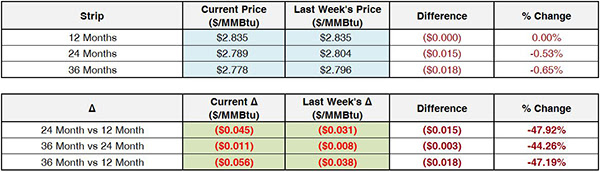
The May 2018 NYMEX Futures price was $2.705/MMBtu prior to the report’s release and has since decreased to $2.685/MMBtu.
Outlook for the Balance of Storage Season:
The graph below compares historical 12, 24 and 36 month strip prices and storage levels for the past 5 years.

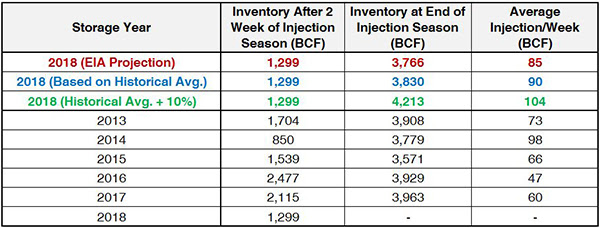
The following table shows the injection numbers we will need to average by week to hit selected historical levels:
The following two graphs show current natural gas in storage compared to each of the last 5 years and weekly storage averages and patterns.
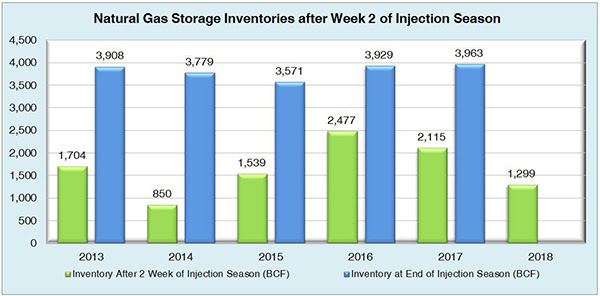

The graph below shows the injections through the current week over the past 5 years.

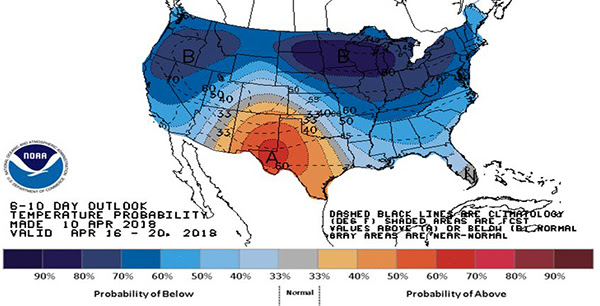
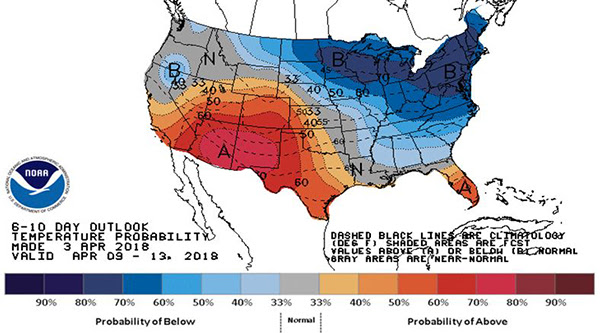
Finally, the graphics below depicts the 6 to 10 day temperature range outlook from the National Weather Service.
Current Week’s Outlook
Future Outlook