The severity and duration of outages from the hurricanes, Harvey and Irma, have created additional uncertainty regarding energy prices in the coming weeks and months. The natural gas market has remained within close range through two major storms, which is unusual based on past historic benchmarks.
Inventories now stand at 3,311 Bcf and are 179 Bcf lower than last year and 43 Bcf above the five-year average. In the East Region 28 Bcf was injected, and the Midwest Region saw inventories rise by 34 Bcf. Stocks in the Mountain Region were 3 Bcf higher, and the Pacific Region was unchanged. The South Central Region added 26 Bcf.
Natural gas holds a strong competitive position among other resources and remains a major fuel in the power sector. Natural gas is projected to increase to 177 Tcf in 2040 and from 124 Tcf in 2015.
Outlook for the Balance of Storage Season:
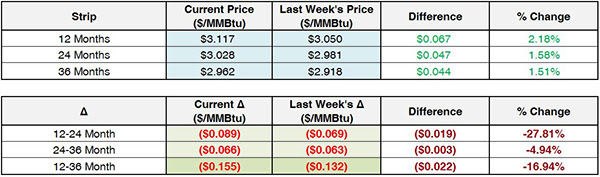
The graph below compares historical 12, 24 and 36 month strip prices and storage levels for the past 5 years.

The following table shows the injection numbers we will need to average by week to hit selected historical levels:

The following two graphs show current natural gas in storage compared to each of the last 5 years and weekly storage averages and patterns.

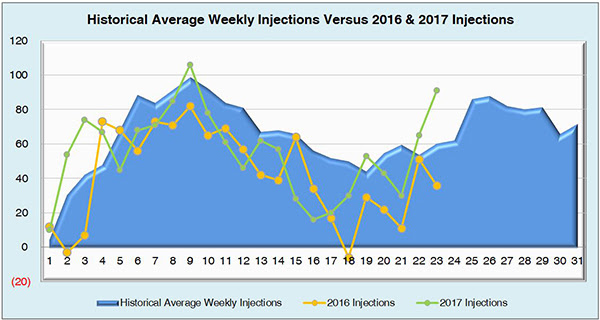
The graph below shows the injections through the current week over the past 5 years.

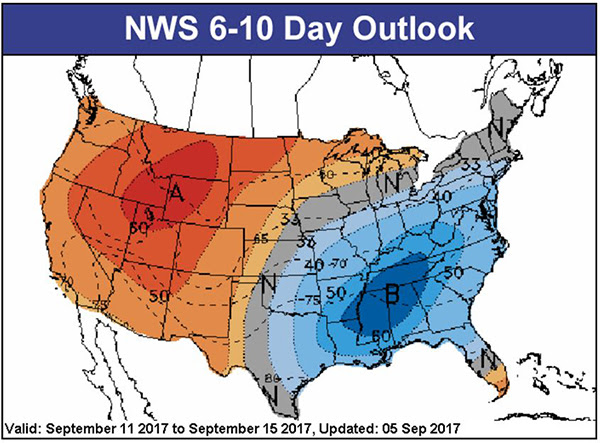
Finally, the graphics below depicts the 6 to 10 day temperature range outlook from the National Weather Service.
Current Week’s Outlook
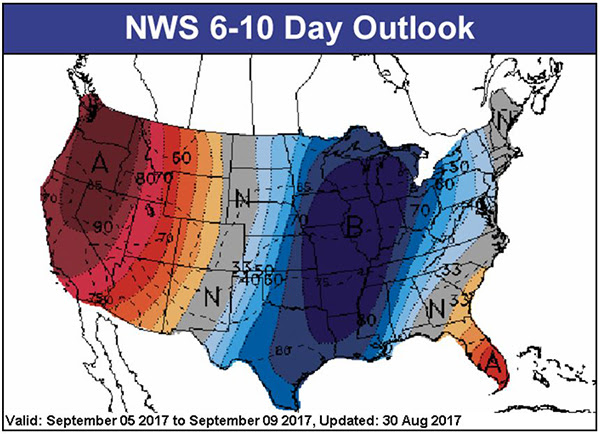
Future Outlook