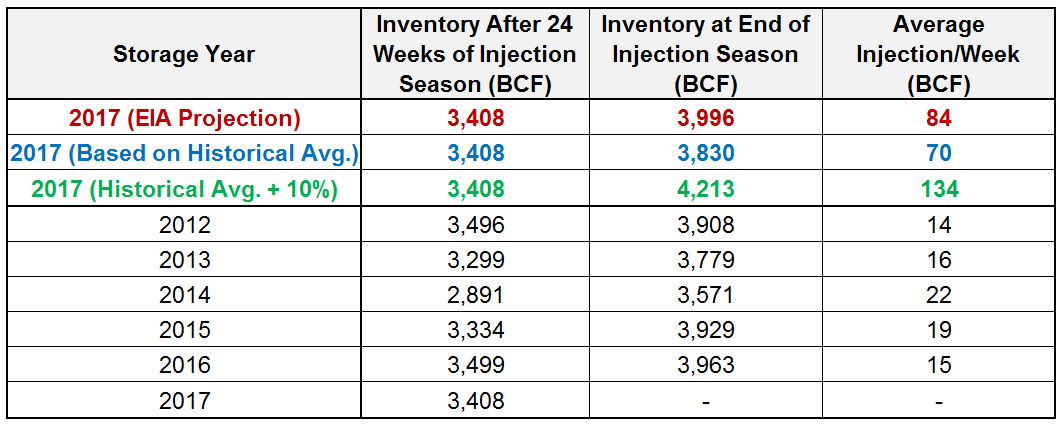
Working natural gas inventories currently stand at 3,408 Bcf which is within the five-year historical range. This figure is 136 Bcf (3.8%) less than this time last year and 67 Bcf (2%) above the five year average of 3,341 Bcf.
The October 2017 NYMEX Futures price started at $3.032/MMBtu prior to the report’s release and has since decreased to $2.979/MMBtu following the EIA report.

Outlook for the Balance of Storage Season:
The graph below compares historical 12, 24 and 36 month strip prices and storage levels for the past 5 years.

The following table shows the injection numbers we will need to average by week to hit selected historical levels:

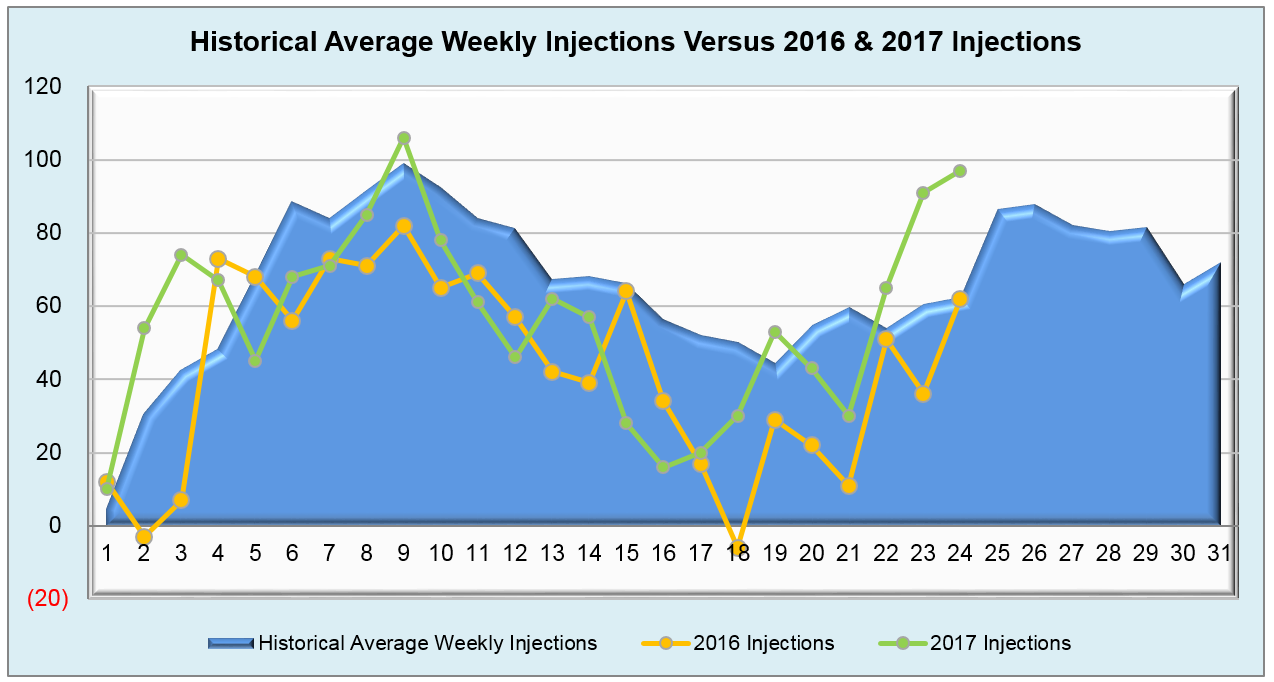
The following two graphs show current natural gas in storage compared to each of the last 5 years and weekly storage averages and patterns.


The graph below shows the injections through the current week over the past 5 years.

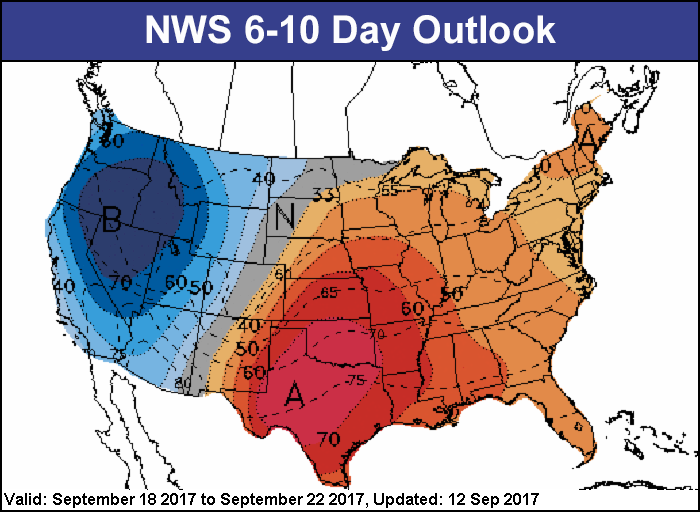
Finally, the graphics below depicts the 6 to 10 day temperature range outlook from the National Weather Service.
Current Week’s Outlook

Future Outlook

