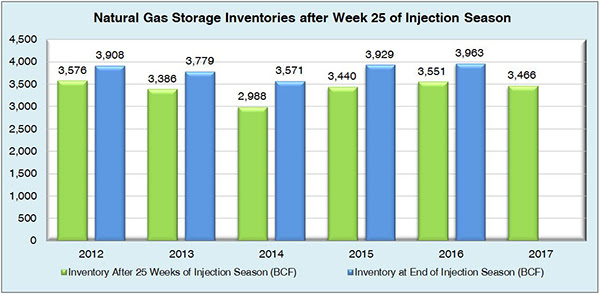
Working natural gas inventories currently stand at 3,466 Bcf. This figure is 127 Bcf (3.7%) less than this time last year and 41 Bcf (1.1%) above the five year average.
The November 2017 NYMEX Future was depressed to $3.04/MmBTU prior to the report’s release but dropped to just over $3.02/MmBTU afterward.

Outlook for the Balance of Storage Season:
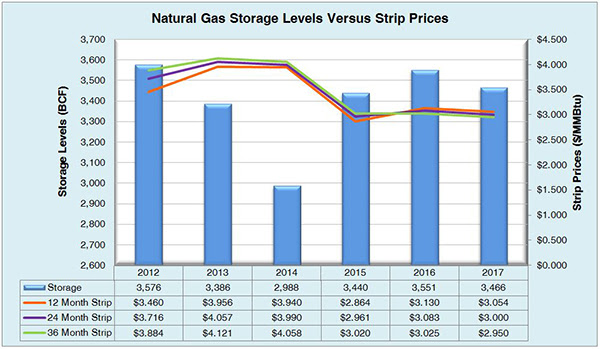
The graph below compares historical 12, 24 and 36 month strip prices and storage levels for the past 5 years.
The following table shows the injection numbers we will need to average by week to hit selected historical levels:

The following two graphs show current natural gas in storage compared to each of the last 5 years and weekly storage averages and patterns.
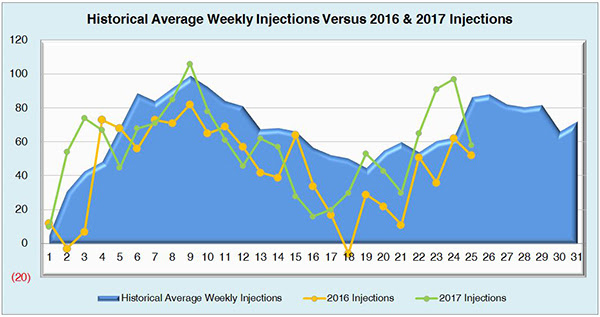
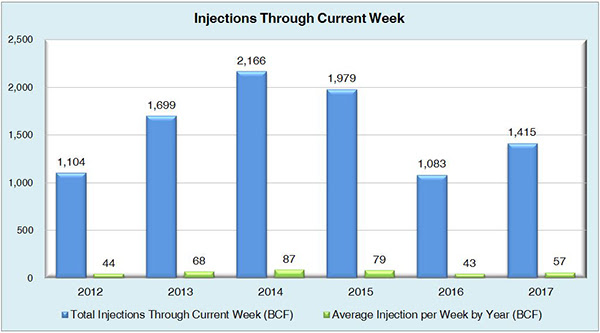
The graph below shows the injections through the current week over the past 5 years.
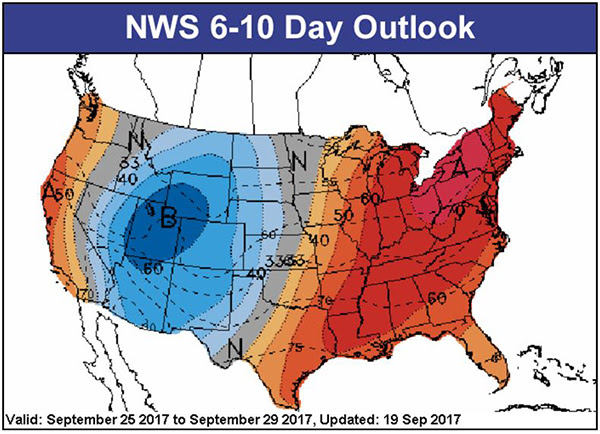
Finally, the graphics below depicts the 6 to 10 day temperature range outlook from the National Weather Service.
Current Week’s Outlook

Future Outlook
