Friday, October 6th, marked the end of week 27 with 82 Bcf injection, 5 Bcf lower than the expectation of 87 Bcf. By comparison, 79 Bcf was injected this time last year and the five year average stands at 87 Bcf.
Working natural gas inventories currently stand at 3,595 Bcf. This figure is 153 Bcf (4.1%) less than this time last year and 8 Bcf (0.2%) below the five year average.
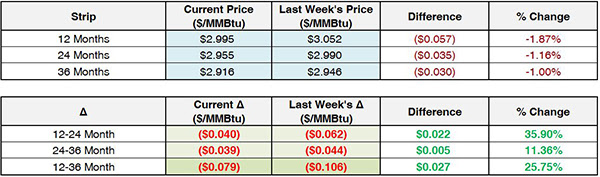
The November 2017 NYMEX Future started at $2.955/MmBTU prior to the report’s release and has since dropped to $2.931/MmBTU afterward.
Outlook for the Balance of Storage Season:
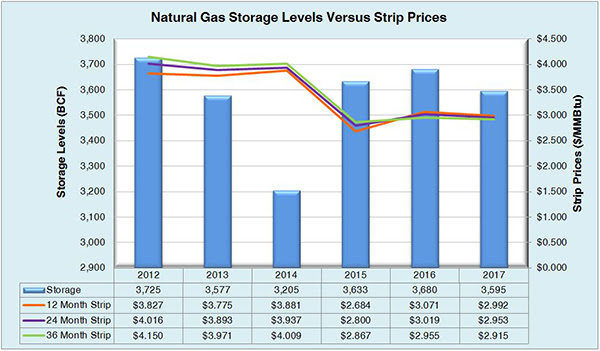
The graph below compares historical 12, 24 and 36 month strip prices and storage levels for the past 5 years.
The following table shows the injection numbers we will need to average by week to hit selected historical levels:

The following two graphs show current natural gas in storage compared to each of the last 5 years and weekly storage averages and patterns.
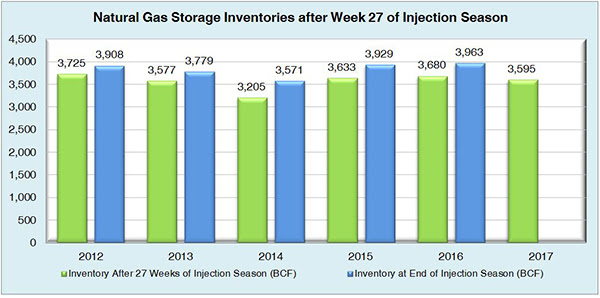
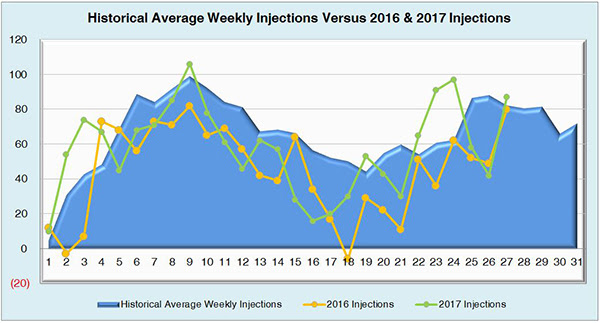
The graph below shows the injections through the current week over the past 5 years.

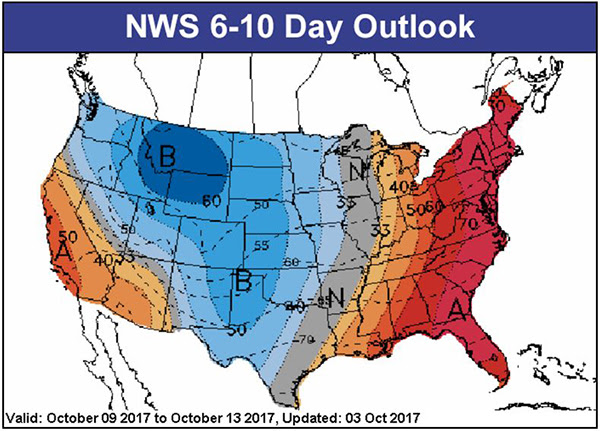
Finally, the graphics below depicts the 6 to 10 day temperature range outlook from the National Weather Service.
Current Week’s Outlook

Future Outlook