Despite heating and cooling demand both maintaining a presence across the Lower 48 during the most recent reporting period, the current background state remains mostly bearish to slightly neutral in regards to the June NYMEX contract. This week’s injection of 123 Bcf is projected to be the first of a few triple-digit builds that could continue through the remainder of the shoulder season. Against last year’s build of 50 Bcf and the five-year average of 70 Bcf, it’s safe to say that this year’s injection season is off to a much more supportive start than last summer when dealing with closing the storage inventory deficit. The South Central region will be one of the first points of reference for summer price expectations once cooling degree days start to ramp up during June, July, and August (as they often do annually). Until then, rangebound trading is looking to be the norm yet again for the time being as demand has been lower due to milder weather, power burns have also decreased, and a weak El Nino seems to be forming over the next few months. Now that storage inventories are getting a chance to recover from last year, they could build back into the five-year average range and potentially help mitigate volatility that was seen during this past withdrawal season.
Working natural gas in storage currently stands at 1,462 Bcf, which is 128 Bcf (9.6%) higher than this time last year and 316 Bcf (17.8%) lower than the five-year average.
The June 2019 NYMEX Futures price began the day around $2.61/MMBtu prior to the report’s release and dropped to $2.57/MMBtu after the report was posted.
Outlook for the Balance of Storage Season:
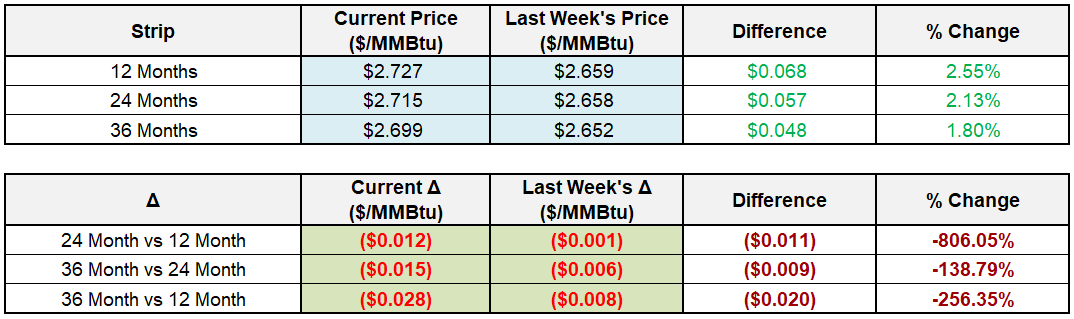
The graph below compares historical 12, 24 and 36 month strip prices and storage levels for the past 5 years.

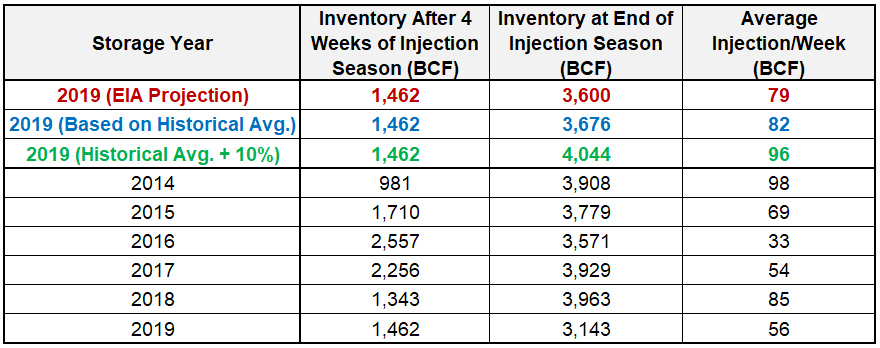
The following table shows the injection numbers we will need to average by week to hit selected historical levels:
The following two graphs show current natural gas in storage compared to each of the last 5 years and weekly storage averages and patterns.

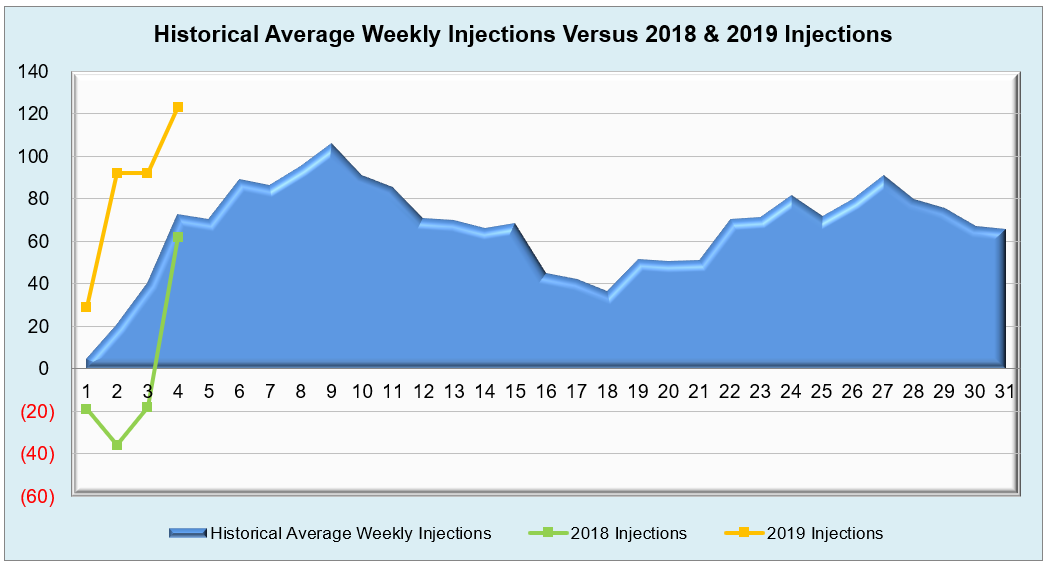
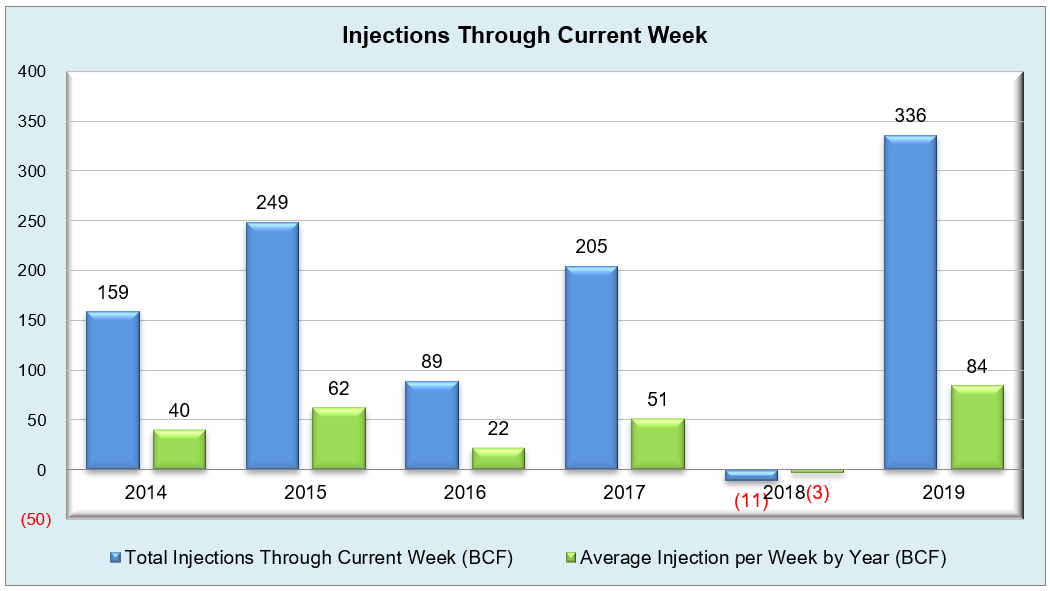
The graph below shows the injections through the current week over the past 5 years.
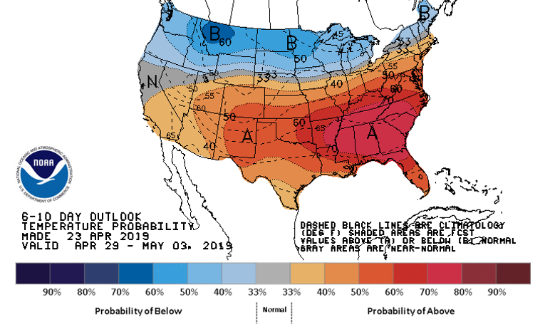
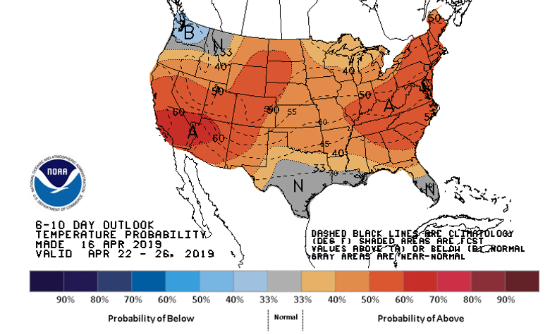
Finally, the graphics below depicts the 6 to 10 day temperature range outlook from the National Weather Service.
Current Week’s Outlook
Future Outlook