The market continues to figure itself out for yet another week as the market expectation of a 183 Bcf withdrawal was exceeded by the EIA’s report of a 194 Bcf pull. Despite the apparent delay until early March of colder weather being reported, today’s slightly bullish move managed to eclipse last year’s draw of 120 Bcf and the five-year average value of 154 Bcf as well. Interestingly enough, this withdrawal comes after a recent drop in heating degree days and overall bearish sentiments in multiple weather models. The deficits in comparison to last year are certainly noted, but the expected surge of production throughout the rest of 2018 is poised to become more of a force when dealing with the expected movement of natural gas prices instead of fundamental factors such as weather. However, this doesn’t negate the mild weather patterns expected in the coming weeks, but the market certainly doesn’t seem to have any motivation to make significant moves in the near future.
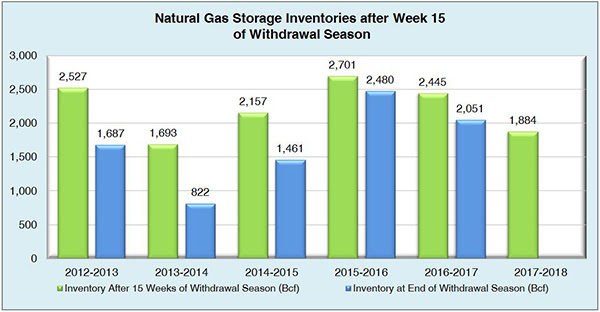
Working natural gas inventories currently stand at 1,884 Bcf. This figure is 577 Bcf (23.4%) less than this time last year and 433 Bcf (18.7%) below the five year average.
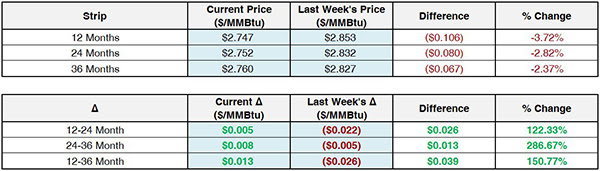
The March 2018 NYMEX Futures price started around $2.57/MMBtu prior to the report’s release and has since risen to $2.59/MMBtu.
Outlook for the Balance of Storage Season:
The graph below compares historical 12, 24 and 36 month strip prices and storage levels for the past 5 years.

The following table shows the injection numbers we will need to average by week to hit selected historical levels:

The following two graphs show current natural gas in storage compared to each of the last 5 years and weekly storage averages and patterns.

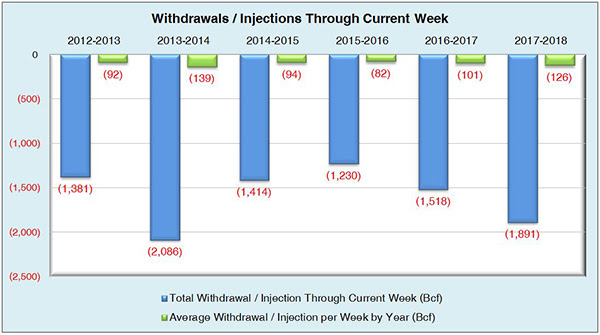
The graph below shows the injections through the current week over the past 5 years.
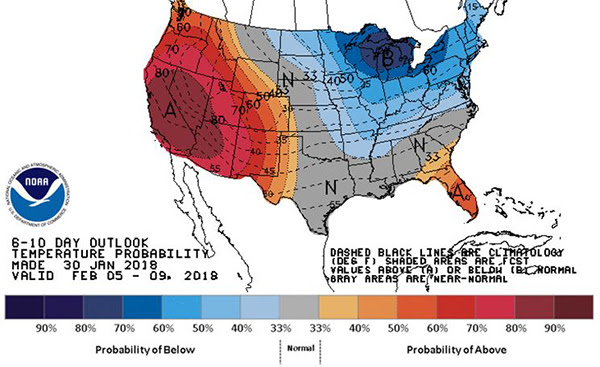
Finally, the graphics below depicts the 6 to 10 day temperature range outlook from the National Weather Service.
Current Week’s Outlook
Future Outlook
