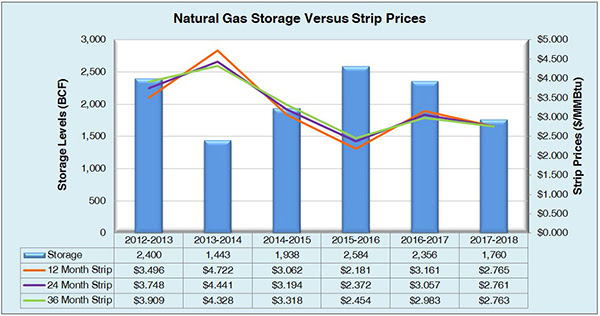
Working natural gas inventories currently stand at 1,760 Bcf. This figure is 609 Bcf (25.7%) less than this time last year and 412 Bcf (19.0%) below the five year average.
The March 2018 NYMEX Futures price started around $2.64/MMBtu prior to the report’s release and has since slightly increased to $2.65/MMBtu.

Outlook for the Balance of Storage Season:
The graph below compares historical 12, 24 and 36 month strip prices and storage levels for the past 5 years.

The following table shows the injection numbers we will need to average by week to hit selected historical levels:

The following two graphs show current natural gas in storage compared to each of the last 5 years and weekly storage averages and patterns.


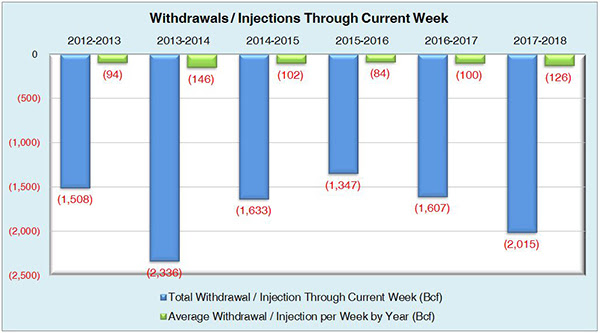
The graph below shows the injections through the current week over the past 5 years.

Finally, the graphics below depicts the 6 to 10 day temperature range outlook from the National Weather Service.
Current Week’s Outlook

Future Outlook

