In a bearish move, the EIA reported a 2 Bcf net injection for the fifth week of withdrawal season, which was notably off the mark of the market expectation of a 7 Bcf withdrawal. This injection also pales in comparison to last year’s withdrawal of 43 Bcf and the five-year average of 69 Bcf taken out of storage. Taking into account the tricky schedule of Thanksgiving/Black
Friday and an unseasonably warm week, it’s no surprise that an injection during withdrawal season is unfavorable for the bulls who have been searching for their chance to finally buy into the expected colder winter. However, this could change by the next report as updated weather data reflects multiple cold blasts in the south that recently occurred and future movement of similar patterns that are to appear in the northern and eastern United States over the next couple of weeks. This anticipated, elevated demand might just be the inspiration the bulls need to spark some interest again.
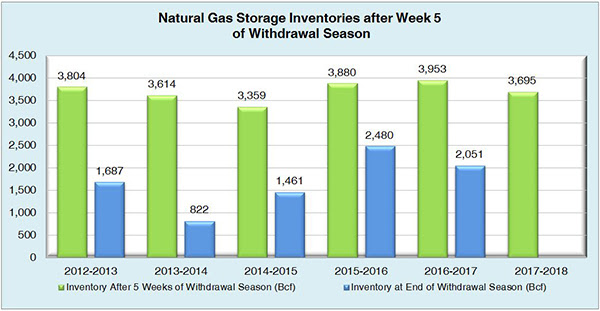
Working natural gas inventories currently stand at 3,695 Bcf. This figure is 264 Bcf (6.7%) less than this time last year and 36 Bcf (1.0%) below the five year average.
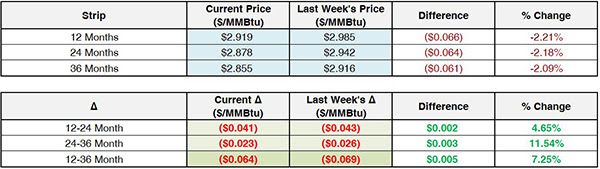
The January 2018 NYMEX Future stood $2.80/MMBtu before the report’s release, and has since dropped to $2.79/MMBtu.
Outlook for the Balance of Storage Season:
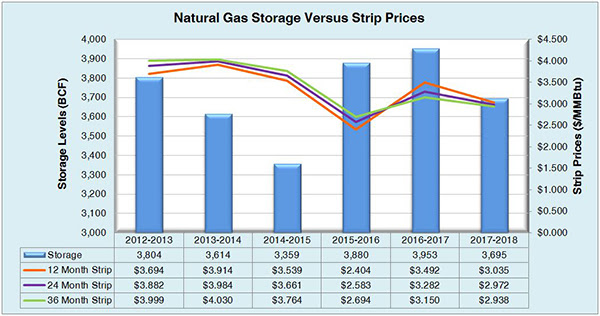
The graph below compares historical 12, 24 and 36 month strip prices and storage levels for the past 5 years.
The following table shows the injection numbers we will need to average by week to hit selected historical levels:

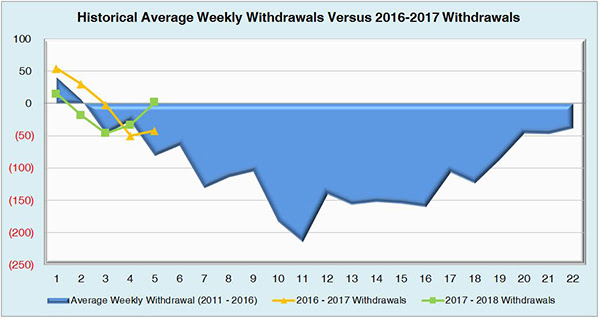
The following two graphs show current natural gas in storage compared to each of the last 5 years and weekly storage averages and patterns.
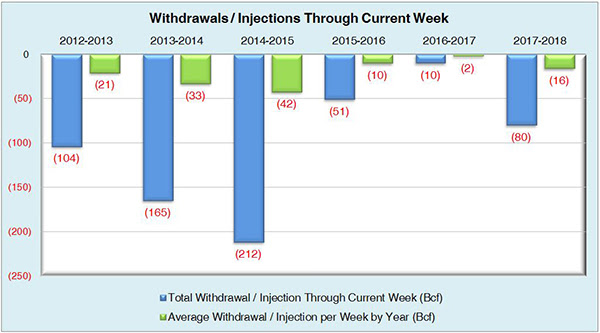
The graph below shows the injections through the current week over the past 5 years.
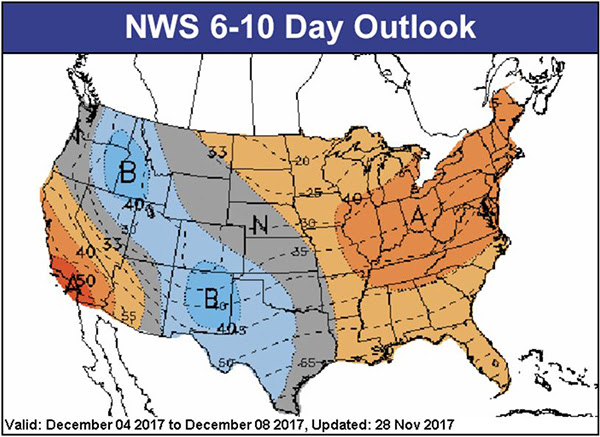
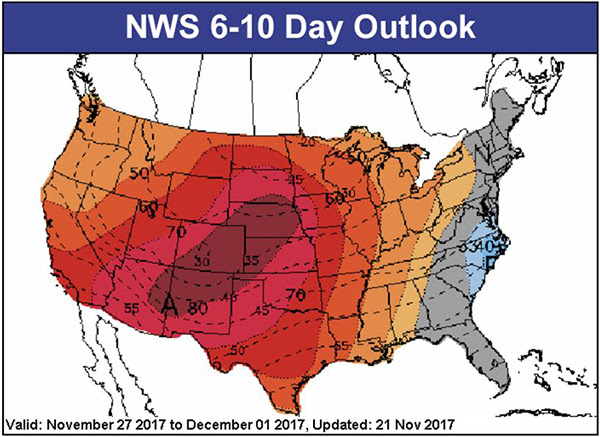
Finally, the graphics below depicts the 6 to 10 day temperature range outlook from the National Weather Service.
Current Week’s Outlook
Future Outlook: