Lower than expected injections are in short supply this summer, and this week’s build of 55 Bcf ended up joining that group as it failed to meet the market expectation of 59 Bcf. Despite that, the current change in storage still eclipsed last year’s 46 Bcf build along with the five-year average of 43 Bcf. Fundamentally, hot weather made its presence known in the Northeast, West, and Texas regions, while the remainder of the Lower 48 stuck around normal temperatures. Production fell just short of yet another record during the reporting period and has easily bounced back since Barry, even as power burns and LNG exports to Mexico also increased at a nearly equally impressive rate. In addition to this, analysts from Genscape stated “On a weather-adjusted basis, injections have averaged 2.6 Bcf/d higher than the five-year average over the last three months. With this we see prompt month prices testing lows not registered in at least the past 40 months.” All things considered, $2 gas on the prompt month may not be entirely out of the question right now, but the heat we’ve seen in August is doing all it can to prevent that.
Working natural gas in storage currently stands at 2,689 Bcf, which is 343 Bcf (14.6%) higher than this time last year and 111 Bcf (-4.0%) lower than the five-year average.
The September 2019 NYMEX Futures price began the day around $2.11/MMBtu prior to the report’s release and increased to $2.15/MMBtu after the report was posted.
Outlook for the Balance of Storage Season:
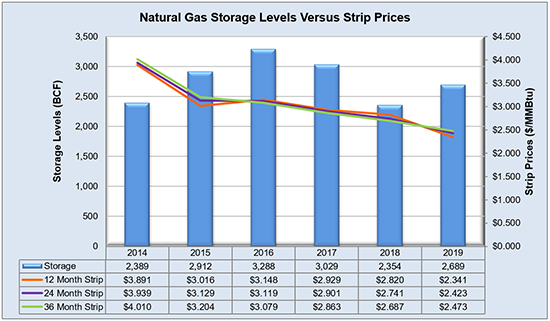
The graph below compares historical 12, 24 and 36 month strip prices and storage levels for the past 5 years.
The following table shows the injection numbers we will need to average by week to hit selected historical levels:

The following two graphs show current natural gas in storage compared to each of the last 5 years and weekly storage averages and patterns.

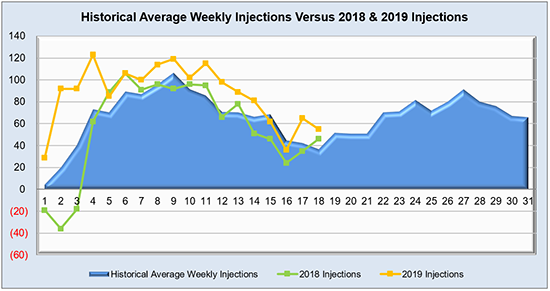
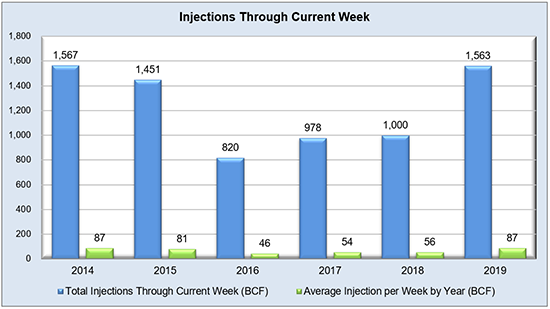
The graph below shows the injections through the current week over the past 5 years.
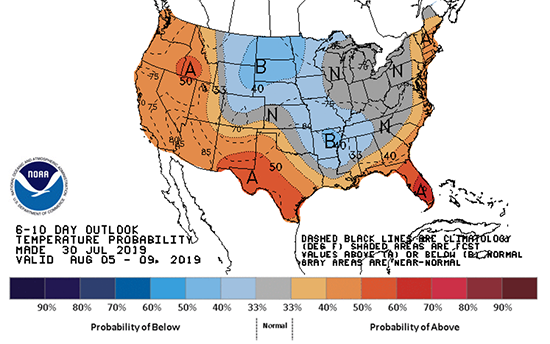
Finally, the graphics below depicts the 6 to 10 day temperature range outlook from the National Weather Service.
Current Week’s Outlook

Future Outlook