Natural Gas Storage Report Injection Season Week 19 (Week Ending August 9th, 2019)

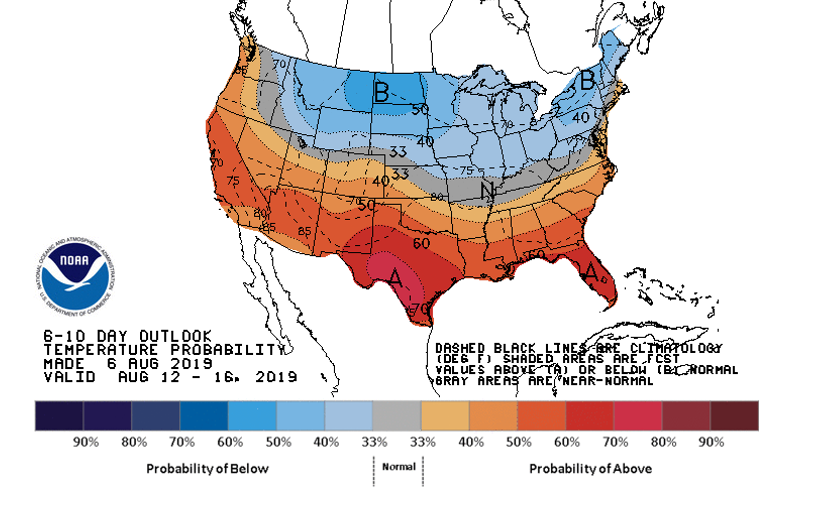
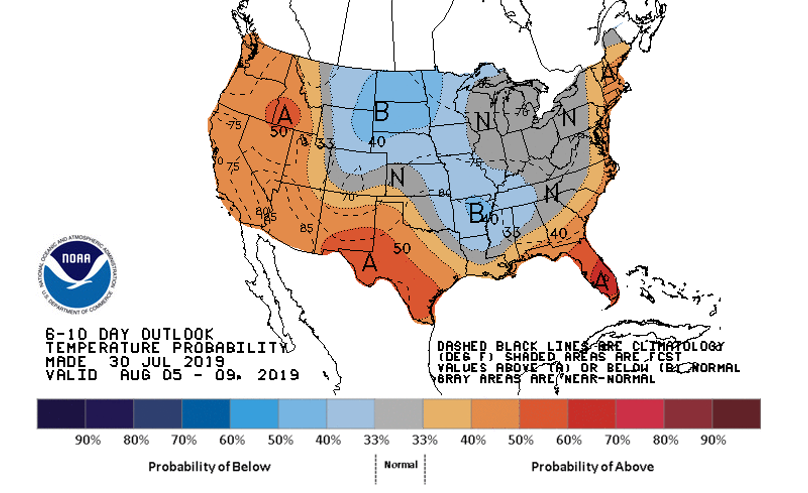
August has been a hot month so far, and this certainly has been reflected in the most recent injection of 49 Bcf into storage. This value fell significantly short of expectations that ranged from 58 Bcf to 61 Bcf, surpassed last year’s injection of 35 Bcf, and matched the five-year average. Fundamentally, a majority of the Lower 48 saw above normal temperatures which are expected to hold through next week and then fade some as we head into the last part of the month. ERCOT in particular has seen some grid stress and increases in demand. All other power hub real time index prices have been muted, however. NYMEX futures are returning to the $2.20 range for the time being, but the longevity of this trend more than likely will be determined by the sustainability of the current heat. As we push into the shoulder season and eventually winter, end of injection season inventory estimates are clocking in around the 3.8 Tcf range. This is well within the five-year average.

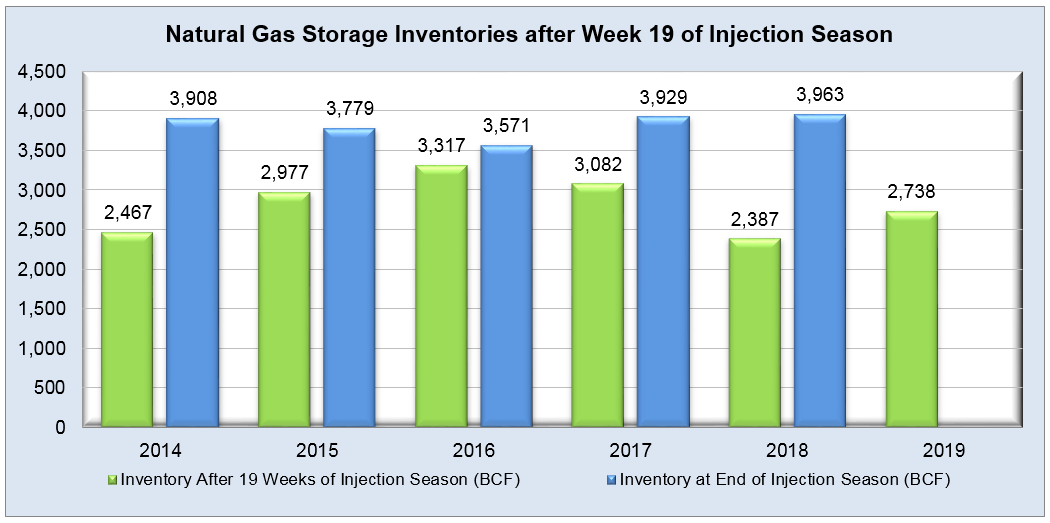
Working natural gas in storage currently stands at 2,738 Bcf, which is 357 Bcf (15.0%) higher than this time last year and 111 Bcf (-3.9%) lower than the five-year average.

The September 2019 NYMEX Futures price began the day around $2.16/MMBtu prior to the report’s release and increased to $2.26/MMBtu after the report was posted.

Outlook for the Balance of Storage Season:

The graph below compares historical 12, 24 and 36 month strip prices and storage levels for the past 5 years.

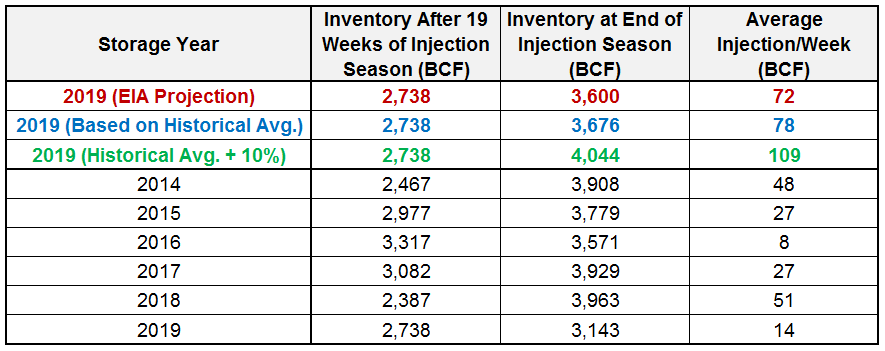
The following table shows the injection numbers we will need to average by week to hit selected historical levels:
The following two graphs show current natural gas in storage compared to each of the last 5 years and weekly storage averages and patterns.
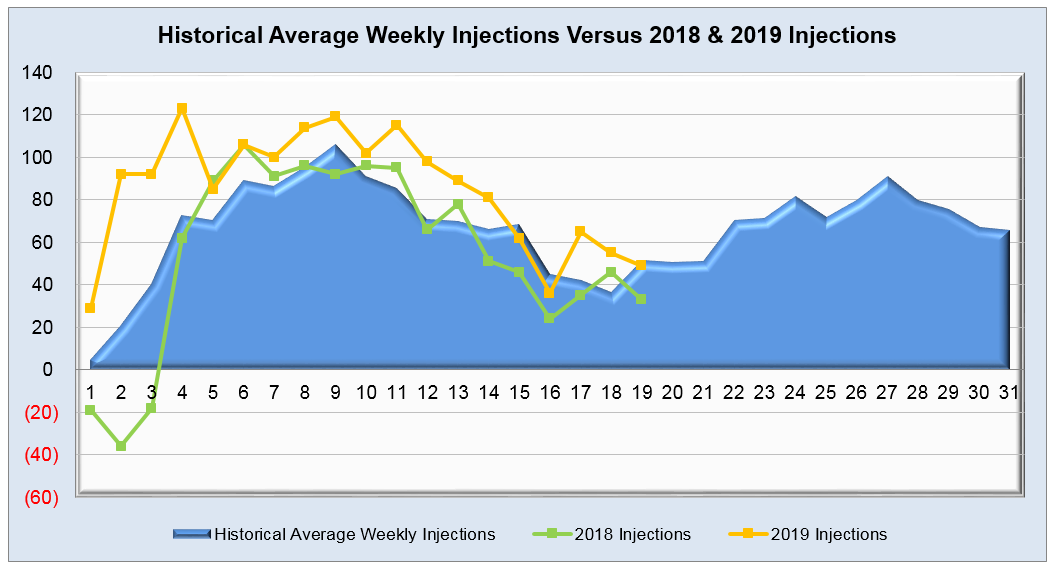
The graph below shows the injections through the current week over the past 5 years.

Finally, the graphics below depicts the 6 to 10 day temperature range outlook from the National Weather Service.

Current Week’s Outlook
Future Outlook