Real time rates in ERCOT may have caught some heat this last week, but storage continued to build and meet expectations with a 59 Bcf injection. Yet again surpassing last year’s 47 Bcf build and the five-year average of 51 Bcf, natural gas inventories are chugging along just fine, and the consensus (so far) is that the Lower 48 should be well supplied for the upcoming winter with a projected 3.5 to 3.7 Tcf in stock. Fundamentally, ERCOT and other portions of the south are still getting scorched, but relief, albeit brief, is slotted for the end of August as we begin the journey into the shoulder season. The last of the “first wave” of LNG terminals is operational and will begin making deliveries in September, so more demand will eventually makes its way into the equation. With approximately ten weeks left in injection season, the main aspect to watch will be the remainder of the heat in the southern regions and its effect on natural gas inventories in the regions. Power hub pricing in PJM IL North, PJM West, NYISO Zone J, and ISO-NE Internal have made little to no movement during the reporting period.
Working natural gas in storage currently stands at 2,797 Bcf, which is 369 Bcf (15.2%) higher than this time last year and 103 Bcf (-3.6%) lower than the five-year average.
The September 2019 NYMEX Futures price began the day around $2.16/MMBtu prior to the report’s release and increased to $2.18/MMBtu after the report was posted.
Outlook for the Balance of Storage Season:
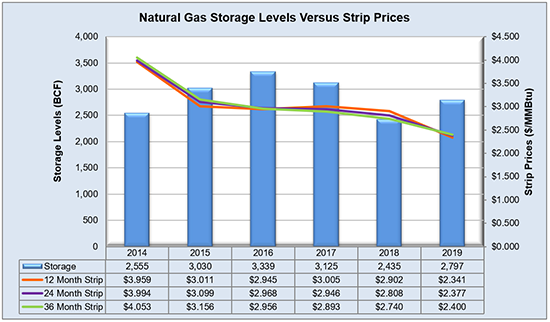
The graph below compares historical 12, 24 and 36 month strip prices and storage levels for the past 5 years.
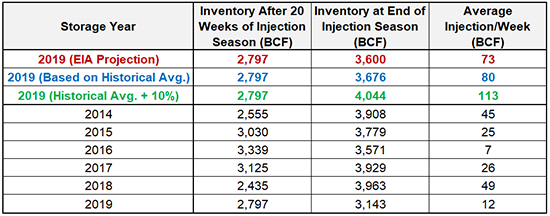
The following table shows the injection numbers we will need to average by week to hit selected historical levels:
The following two graphs show current natural gas in storage compared to each of the last 5 years and weekly storage averages and patterns.
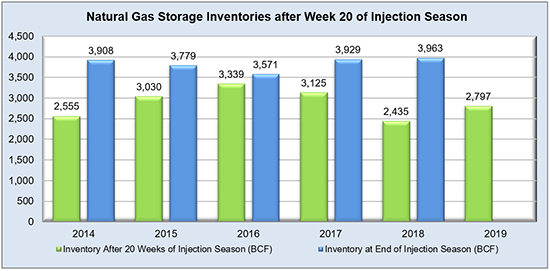
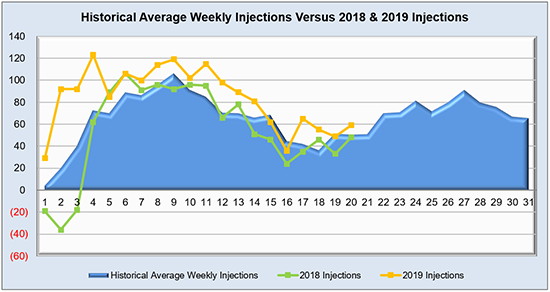
The graph below shows the injections through the current week over the past 5 years.

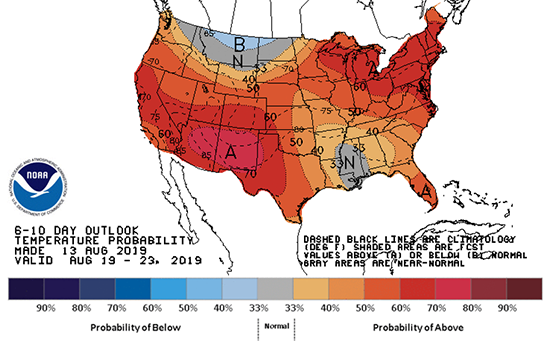
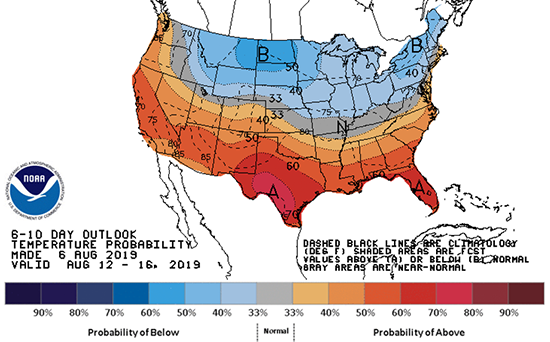
Finally, the graphics below depicts the 6 to 10 day temperature range outlook from the National Weather Service.
Current Week’s Outlook
Future Outlook