EIA’s reported injection of 60 Bcf was mostly a non-event but could be seen as a tad bearish since it surpassed a few market expectations while staying within a common range. It even fell between last year’s 66 Bcf build and the five-year average of 57 Bcf for the same time period. All in all, the fundamentals showed little surprises as the South and West continued to see heat as the remainder of the Lower 48 dealt with precipitation and mostly normal temperatures. Both dry gas production and demand spurred by LNG terminals becoming operable have notably increased at an equal pace during the reporting period, leaving trading mostly rangebound above the $2.20/MMBtu mark. Power hub indices have returned to their regularly scheduled programming after a brief but substantial jump in both major ERCOT hubs due to operating reserves reaching worrisome levels midway through August. Overall, the market seems to have levelled out for the shoulder season ahead despite being a slight bit oversupplied. Hopefully that means we don’t get another surprise like the spike sen in November 2018.
Working natural gas in storage currently stands at 2,857 Bcf, which is 363 Bcf (14.6%) higher than this time last year and 100 Bcf (-3.4%) lower than the five-year average.
The October 2019 NYMEX Futures price began the day around $2.23/MMBtu prior to the report’s release and increased to $2.26/MMBtu after the report was posted.
Outlook for the Balance of Storage Season:
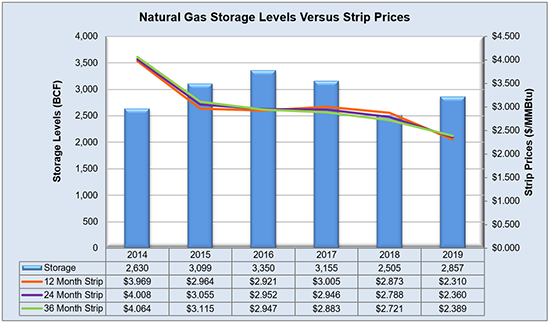
The graph below compares historical 12, 24 and 36 month strip prices and storage levels for the past 5 years.
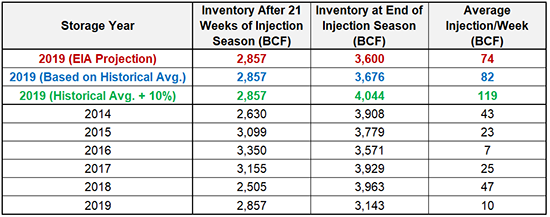
The following table shows the injection numbers we will need to average by week to hit selected historical levels:
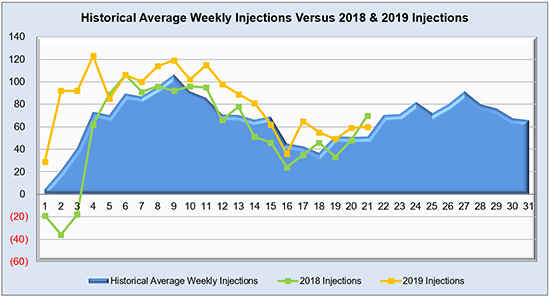
The following two graphs show current natural gas in storage compared to each of the last 5 years and weekly storage averages and patterns.

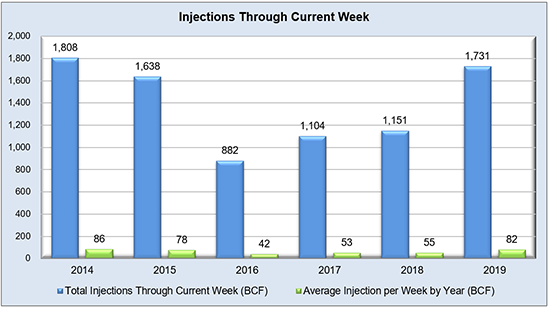
The graph below shows the injections through the current week over the past 5 years.
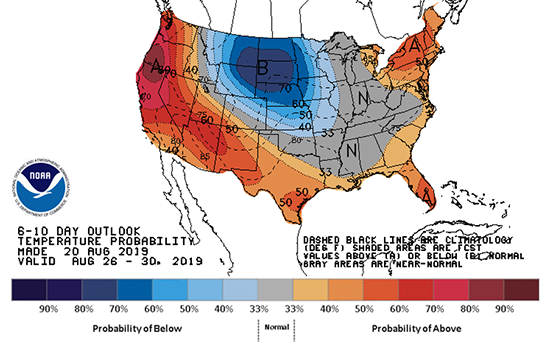
Finally, the graphics below depicts the 6 to 10 day temperature range outlook from the National Weather Service.
Current Week’s Outlook

Future Outlook