The recent rally realized on NYMEX futures really remains on the technical side with what is being reported as a “short squeeze”, and the lack of strong fundamentals lately can mostly corroborate this. Regarding fundamentals, this week’s 78 Bcf injection fell a little short of the mark compared to expectation in the market, but still eclipsed both notable historical values. With both Labor Day weekend and Dorian to account for in this build, it’s a little surprising that the actual number didn’t exceed what the market was looking for, but production apparently slowed enough to allow for this. Natural gas storage inventories finally made it to the big 3.0 Tcf number this week as well, so the next seven weeks of injection season will be ones to watch as we head ever closer to the projected 3.6 to 3.7 Tcf benchmark for the upcoming winter and withdrawal season. On the power side, ERCOT Houston and North real time hub prices have calmed back down after their notable spikes in August, and the remaining major hubs continue to stay mostly dormant. Once heating degree days begin to enter the equation, the Northeast and New England hubs will probably start picking up more steam, even with a heft supply of natural gas in storage. EIA expects natural gas to rise to almost 38% of utility-scale generation in 2020, so its influence on wholesale prices certainly should not be dismissed.
Working natural gas in storage currently stands at 3,019 Bcf, which is 393 Bcf (15.0%) higher than this time last year and 77 Bcf (-2.5%) lower than the five-year average.
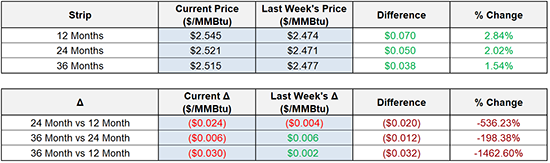
The October 2019 NYMEX Futures price began the day around $2.52/MMBtu prior to the report’s release and increased to $2.57/MMBtu after the report was posted.
Outlook for the Balance of Storage Season:
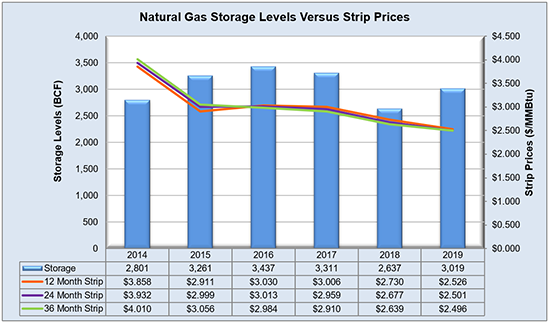
The graph below compares historical 12, 24 and 36 month strip prices and storage levels for the past 5 years.
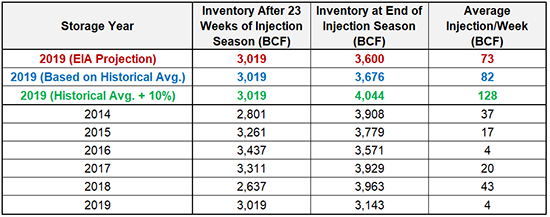
The following table shows the injection numbers we will need to average by week to hit selected historical levels:
The following two graphs show current natural gas in storage compared to each of the last 5 years and weekly storage averages and patterns.
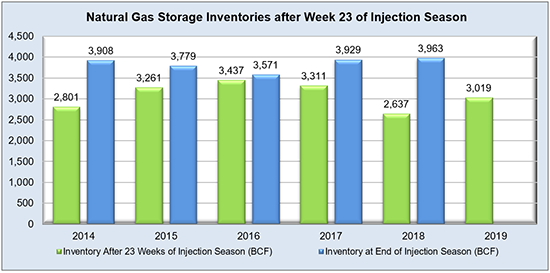

The graph below shows the injections through the current week over the past 5 years.

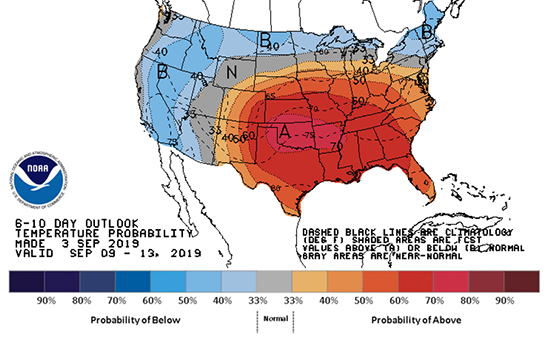
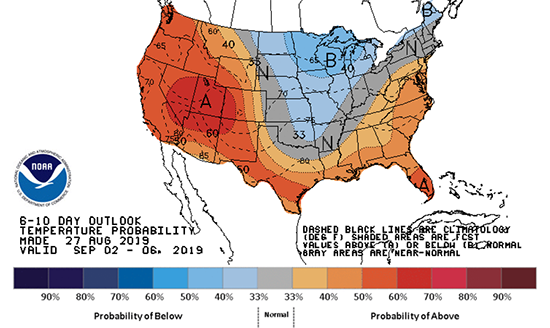
Finally, the graphics below depicts the 6 to 10 day temperature range outlook from the National Weather Service.
Current Week’s Outlook
Future Outlook