Hurricane Dorian has avoided causing notable demand destruction on its path that currently runs in parallel to multiple east coast markets, but the unrelenting presence and strength of natural gas production paired with recent dips in LNG exports have resulted in yet another bearish injection that supplemented storage inventories by 84 Bcf. This exceeded all of the usual metrics, both market expectations and historical values, so even with NYMEX seemingly being driven by more technical factors lately, it should see some downward trends due to this. Weather was mostly a mixed bag during the reporting period, but the heat is expected to ramp back up in ERCOT over the next few days. The integrity of the grid in Texas could see extended intervals of its $9,000/MWh price cap due to high demand and temperatures over 100 degrees at major hubs like Houston and North. As for other notable ISO hubs, PJM IL North, PJM West, ISO-NE Internal, and NYISO Zone J remain either at or below the five-year average for their Real Time Index prices, and little is suggesting that will change until winter arrives and the gas-fired generation that normally comes with it starts to kick in. With just a bit under two months left for the injection season, storage is still looking to end up around the 3.6 to 3.7 Tcf range for the withdrawal season ahead.
Working natural gas in storage currently stands at 2,941 Bcf, which is 383 Bcf (15.0%) higher than this time last year and 82 Bcf (-2.7%) lower than the five-year average.
The October 2019 NYMEX Futures price began the day around $2.44/MMBtu prior to the report’s release and dropped to $2.40/MMBtu after the report was posted.

Outlook for the Balance of Storage Season:
The graph below compares historical 12, 24 and 36 month strip prices and storage levels for the past 5 years.

The following table shows the injection numbers we will need to average by week to hit selected historical levels:

The following two graphs show current natural gas in storage compared to each of the last 5 years and weekly storage averages and patterns.
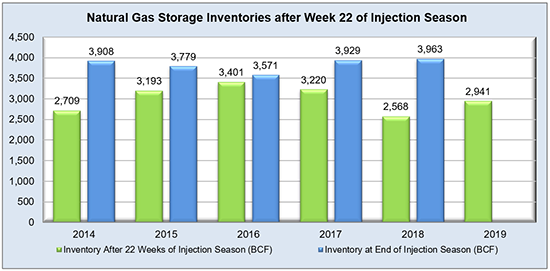

The graph below shows the injections through the current week over the past 5 years.

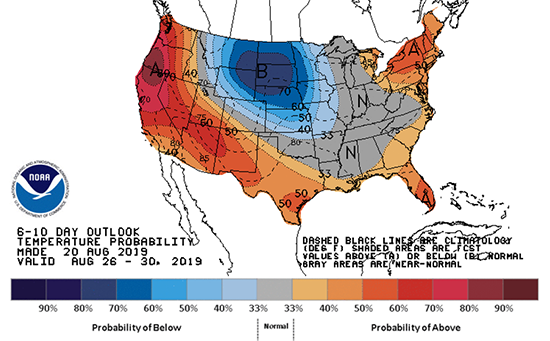
Finally, the graphics below depicts the 6 to 10 day temperature range outlook from the National Weather Service.
Current Week’s Outlook
Future Outlook
