It turns out the third time isn’t the charm as this week’s injection of 98 Bcf broke the triple-digit build streak from the last two weeks. While the current build exceeded last year’s 91 Bcf injection and the five-year average of 89 Bcf for the same time period, the reported 98 Bcf is seen as more of a non-event despite beating most market expectations. Weather-driven demand continues to be shed, according to both the American and European weather models, and natural gas production eclipsed 92 Bcf/d for the first time in a short while over the course of the reporting period as well. No significant amount of heating/cooling degree days have been noted also, which is a sure sign that shoulder season is in full swing. With that in mind, a few reports are floating the possibility out there that the first few weeks of withdrawal season could still see injections due to the current supply/demand picture, but we will just have to wait and see if that is upheld in a few weeks’ time. Power hub index rates continue to meander along with little to report, but the hubs located in PJM, ISO-NE, and NYISO can be expected to see some movement once winter rolls in yet again. Volatility is still on the table when it comes to winter power pricing and extreme weather events, but ample storage should help rein in any large spikes and return them back to seasonal norms in a quicker fashion.
Working natural gas in storage currently stands at 3,415 Bcf, which is 472 Bcf (16.0%) higher than this time last year and 9 Bcf (-0.3%) lower than the five-year average of 3,424 Bcf for the same time period.
The November 2019 NYMEX Futures price began the day around $2.24/MMBtu prior to the report’s release and remained flat after the report was posted.
Outlook for the Balance of Storage Season:
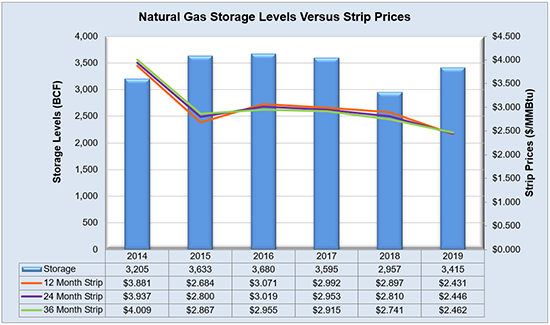
The graph below compares historical 12, 24 and 36 month strip prices and storage levels for the past 5 years.
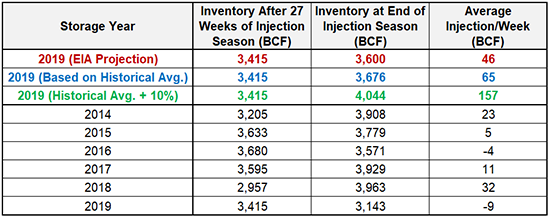
The following table shows the injection numbers we will need to average by week to hit selected historical levels:
The following two graphs show current natural gas in storage compared to each of the last 5 years and weekly storage averages and patterns.
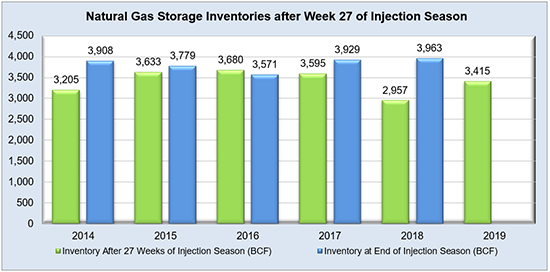
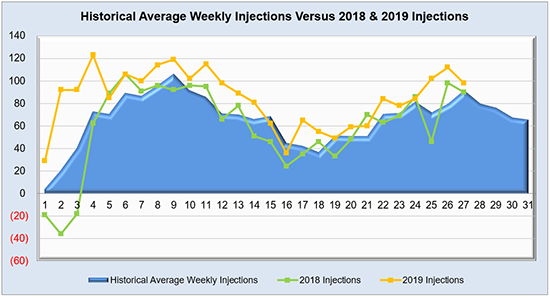
The graph below shows the injections through the current week over the past 5 years.

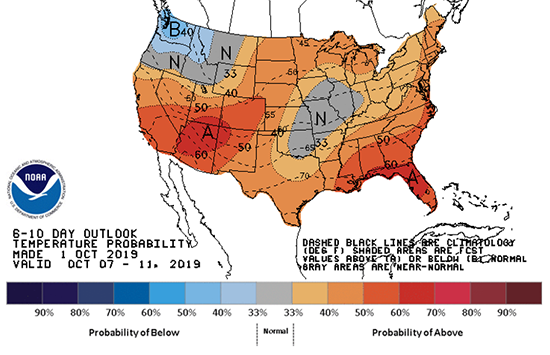
Finally, the graphics below depicts the 6 to 10 day temperature range outlook from the National Weather Service.
Current Week’s Outlook

Future Outlook