The flat to slightly bullish injection of 87 Bcf stands close to market expectations but still managed to surpass the notable historical values of last year’s 62 Bcf build and the five-year average of 73 Bcf for the same time period. The effect of weather seemed minimal as patterns across the Lower 48 were a mixed bag resulting in a fair amount of sideways trading on NYMEX during the reporting period. In the near future, multiple weather desks are calling for colder trends to sweep in for the end of October, but their time to shine is expected to be short as a shift to warmer trends should be coming in shortly after for the beginning of November. Power hub index prices in PJM have yet to be adversely affected, and with a strong possibility of a warmer-than-normal winter ahead, these real time indices could remain below their respective five-year averages. With only a couple of weeks remaining for injection season, it seems that estimates for 3.7 Tcf or so are looking to be right on the money for withdrawal season. This year’s storage picture is showing a more secure inventory than last year, which could keep a lid on Henry Hub for the winter, barring any sort of extended polar vortex event similar to 2014.
Working natural gas in storage currently stands at 3,606 Bcf, which is 519 Bcf (16.8%) higher than this time last year and 28 Bcf (0.8%) higher than the five-year average of 3,578 Bcf for the same time period.
The November 2019 NYMEX Futures price began the day around $2.28/MMBtu prior to the report’s release and increased to $2.29/MMBtu after the report was posted.
Outlook for the Balance of Storage Season:
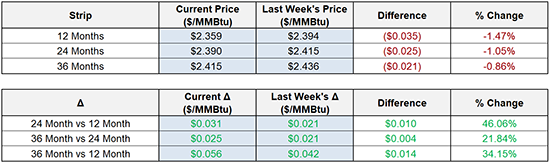
The graph below compares historical 12, 24 and 36 month strip prices and storage levels for the past 5 years.

The following table shows the injection numbers we will need to average by week to hit selected historical levels:

The following two graphs show current natural gas in storage compared to each of the last 5 years and weekly storage averages and patterns.


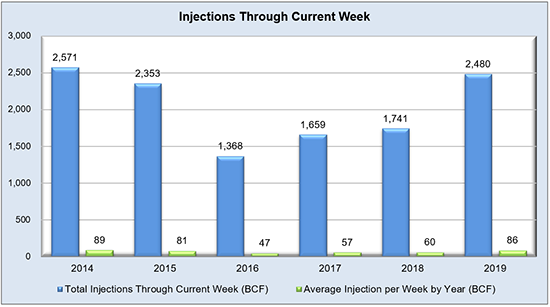
The graph below shows the injections through the current week over the past 5 years.
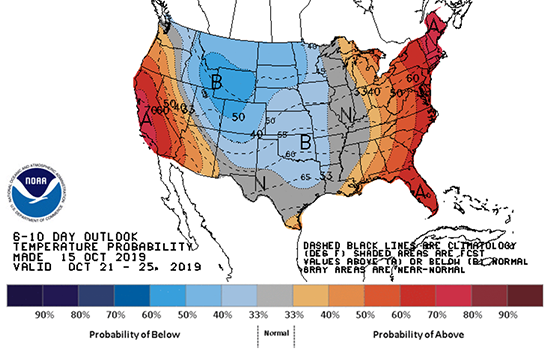
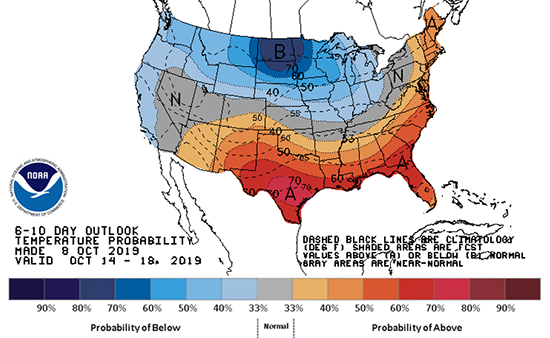
Finally, the graphics below depicts the 6 to 10 day temperature range outlook from the National Weather Service.
Current Week’s Outlook
Future Outlook