After last week’s neutral to bearish build of 123 Bcf, the latest injection of 85 Bcf is giving bulls somewhat of an opportunity to bounce back as slight upticks in heating demand in the northern regions and cooling demand in the southern regions of the U.S. coincided with dry gas production taking somewhat of a hit due to shoulder season pipeline maintenance. This injection not only matched last year’s value and surpassed the five-year average of 72 Bcf, but also continued to notably shrink the deficit in storage inventories for the sixth week in a row following withdrawal season. On the other hand, the first of three trains at the Cameron LNG facility in Louisiana is expected to become operational around mid-May, possibly contributing to an increase in natural gas demand in the South Central region that won’t necessarily tip the scales but could spur some bullish price action once live. These fundamental factors aren’t necessarily behind the recent jump to the $2.60/MMBtu range (a few sources have pointed to technical aspects such as short-covering to explain it), but their influence is steadily increasing as summer approaches, air conditioning use fires up, and consistent streaks of augmented cooling degree days occur.
Working natural gas in storage currently stands at 1,547 Bcf, which is 85 Bcf (9.0%) higher than this time last year and 303 Bcf (-16.4%) lower than the five-year average.
The June 2019 NYMEX Futures price began the day around $2.60/MMBtu prior to the report’s release and dropped to $2.58/MMBtu after the report was posted.

Outlook for the Balance of Storage Season:
The graph below compares historical 12, 24 and 36 month strip prices and storage levels for the past 5 years.

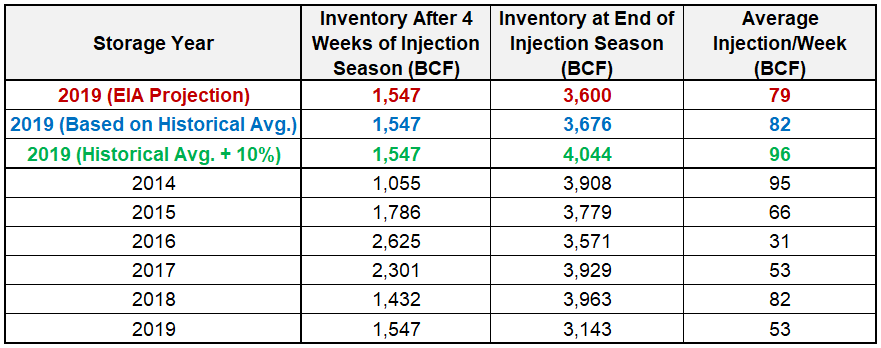
The following table shows the injection numbers we will need to average by week to hit selected historical levels:
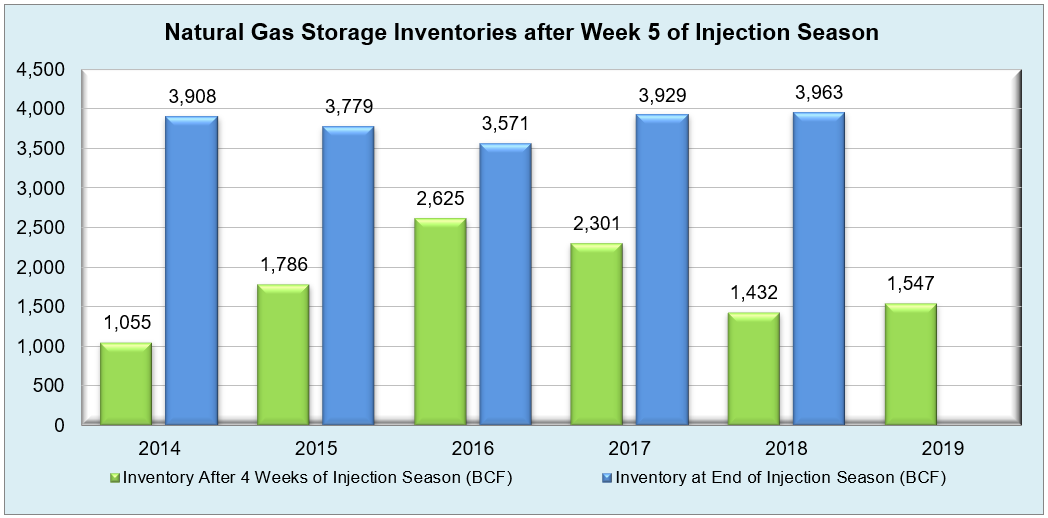
The following two graphs show current natural gas in storage compared to each of the last 5 years and weekly storage averages and patterns.
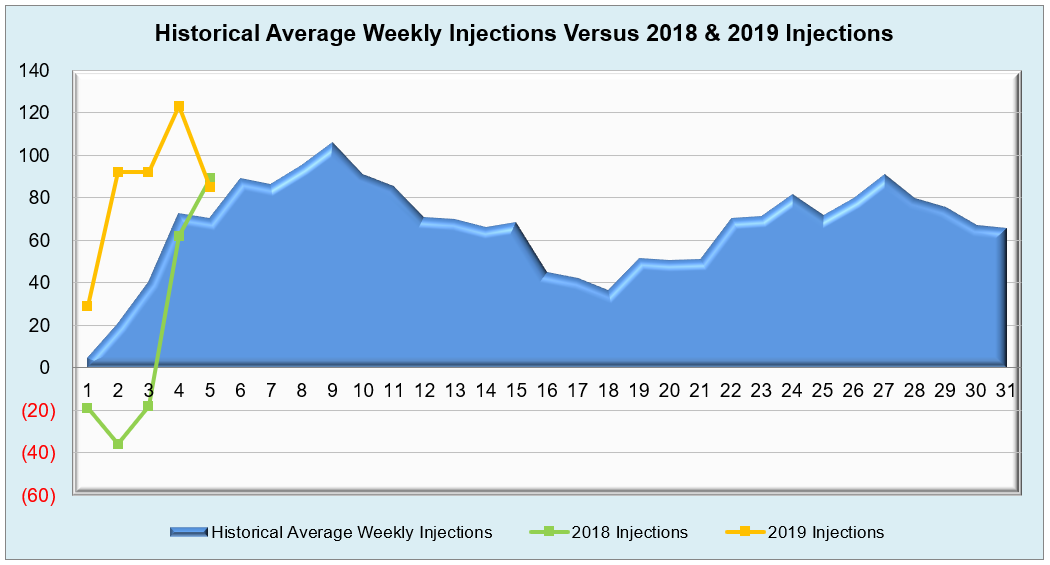
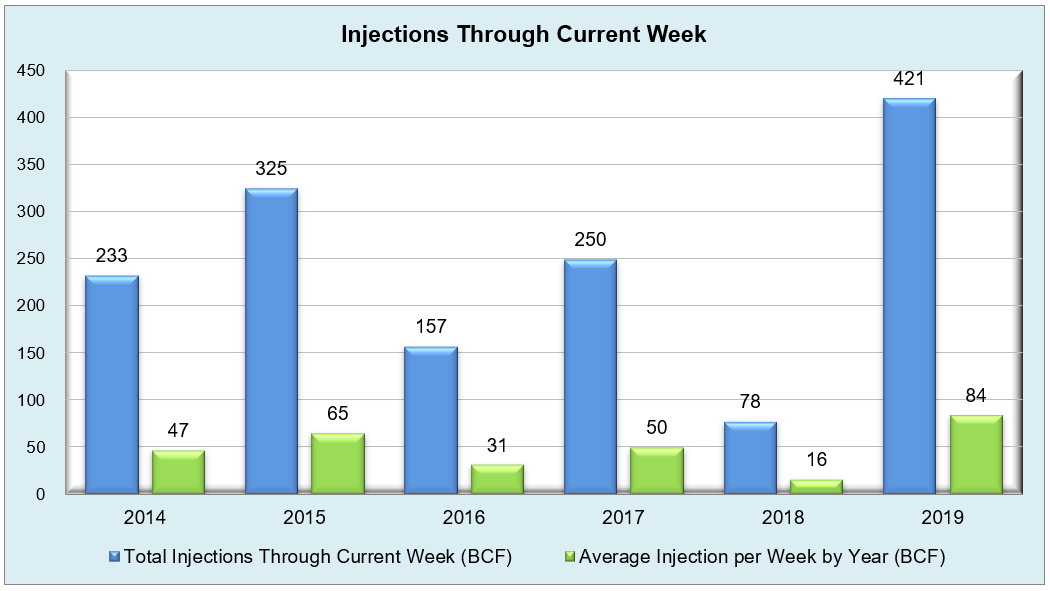
The graph below shows the injections through the current week over the past 5 years.
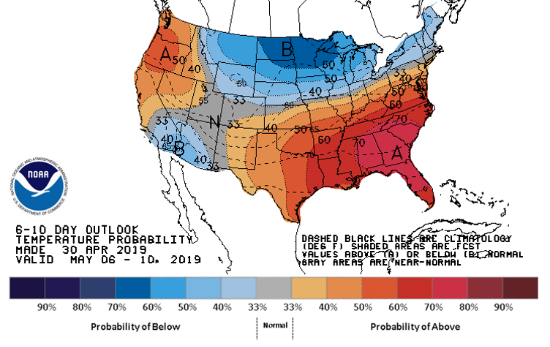
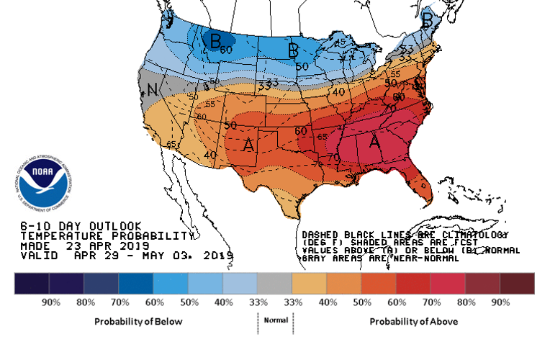
Finally, the graphics below depicts the 6 to 10 day temperature range outlook from the National Weather Service.
Current Week’s Outlook
Future Outlook