This week’s injection of 106 Bcf slightly edged out the general market consensus of 104 Bcf, last year’s build of 104 Bcf, and the five-year average of 89 Bcf for the same time period. NatGasWeather.com reported that “It was cooler than normal across the central U.S. and Midwest, while warmer than normal across the West and East,” which led to the South Central region contributing the highest input for the current build. Even as LNG export terminals are being completed, Mexico increasing their natural gas imports from the U.S., and production somewhat slowed due to seasonal maintenance, the current supply & demand balance still seems to show a slight oversupply. Prompt month NYMEX futures have mostly remained within a range of $2.62 to $2.70/MMBtu range, and injections similar to today’s will be instrumental in keeping any sort of lid on prices should the possible weak El Nino cause an increase in cooling demand and warmer-than-normal weather in key regions such as the East and South Central. That being said, index power markets haven’t seen any sort of notable activity due to the mild spring weather that occurred in April and through the first week of May, and key drivers (most of which are increases) of power prices are cropping up more in continuous legislation being passed instead of the weather and other fundamental factors. Once June begins and air conditioners start firing up however, we’ll see how quickly that changes.
Working natural gas in storage currently stands at 1,653 Bcf, which is 130 Bcf (8.5%) higher than this time last year and 286 Bcf (-14.7%) lower than the five-year average.
The June 2019 NYMEX Futures price began the day around $2.60/MMBtu prior to the report’s release and increased to $2.63/MMBtu after the report was posted.

Outlook for the Balance of Storage Season:
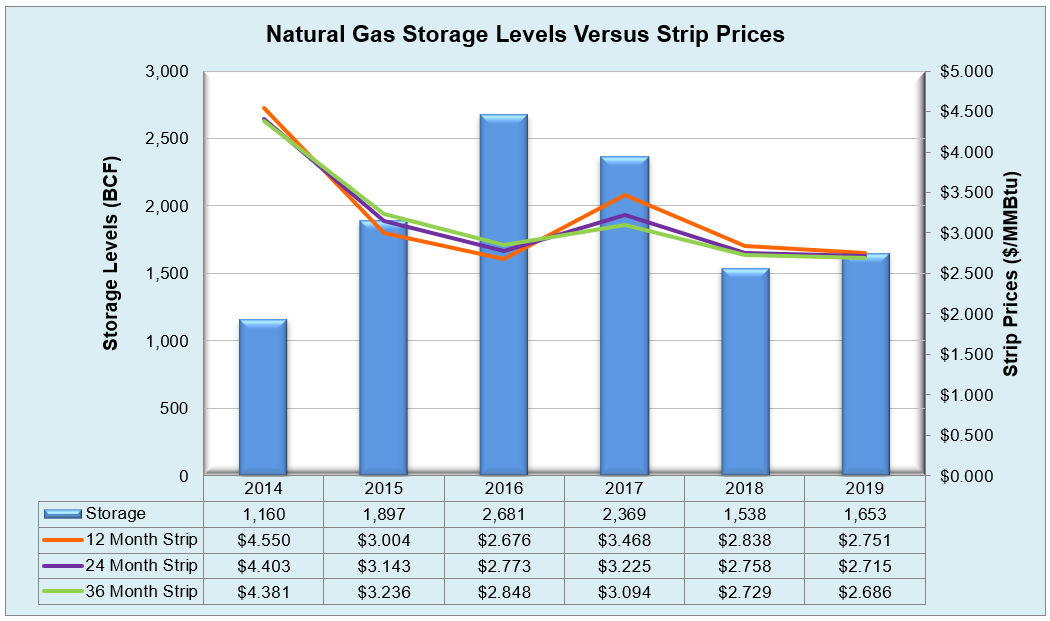
The graph below compares historical 12, 24 and 36 month strip prices and storage levels for the past 5 years.
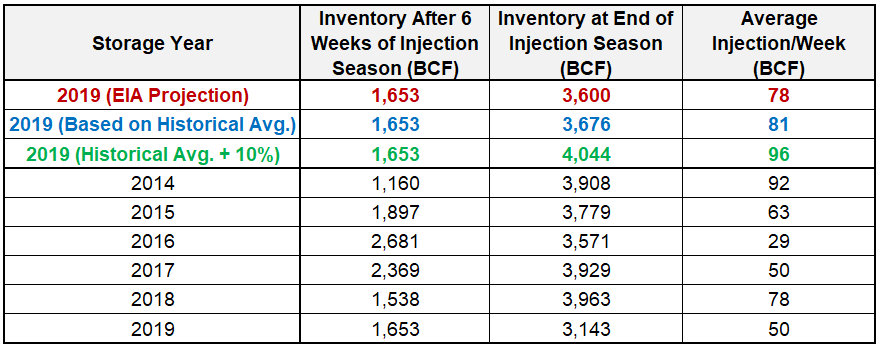
The following table shows the injection numbers we will need to average by week to hit selected historical levels:
The following two graphs show current natural gas in storage compared to each of the last 5 years and weekly storage averages and patterns.
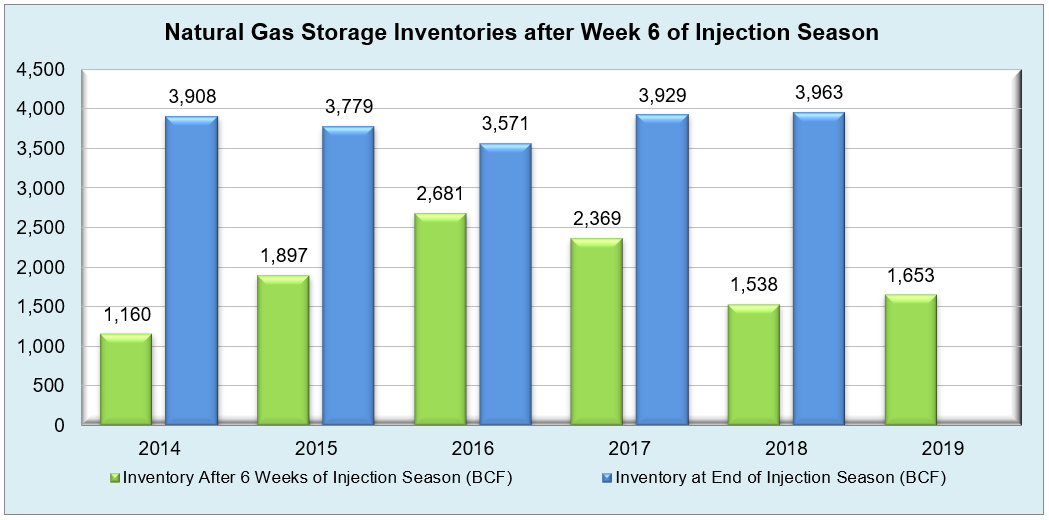
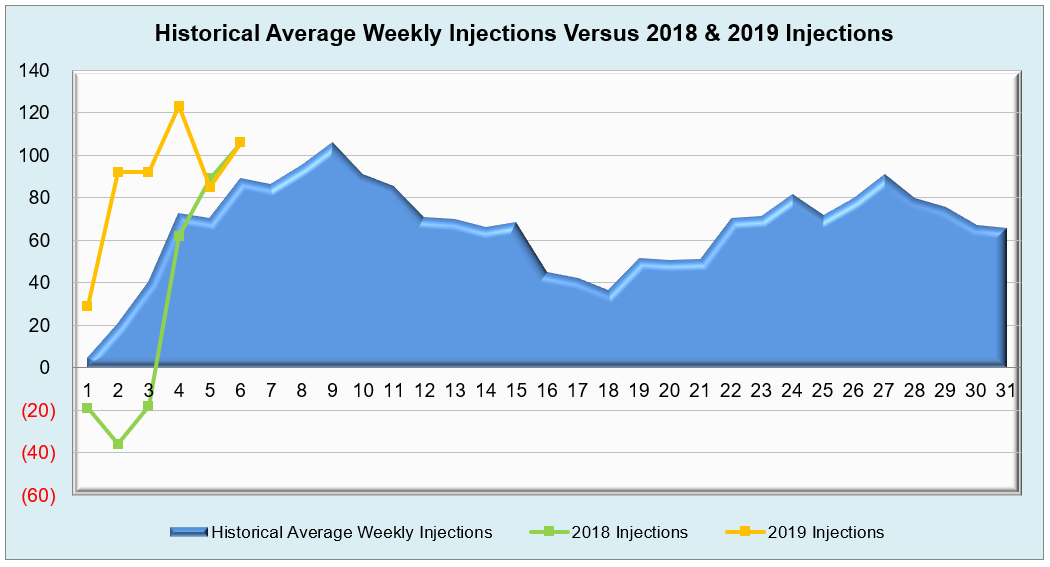
The graph below shows the injections through the current week over the past 5 years.

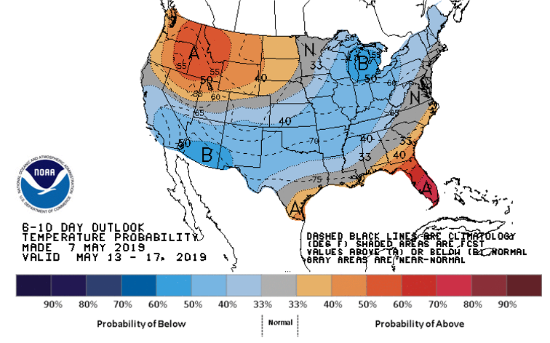
Finally, the graphics below depicts the 6 to 10 day temperature range outlook from the National Weather Service.
Current Week’s Outlook

Future Outlook