This week’s 100 Bcf injection came up slightly short of market expectations, but managed to exceed last year’s value of 93 Bcf and the five-year average of 88 Bcf. Little has changed fundamentally despite slightly warmer changes in the East along with cooler shifts in the West. With any major heat expected to be pushed later into June, the last two trading days have tumbled back under the $2.60/MMBtu mark. Technical aspects seem to be taking the lead as of late. According to Andy Weissman at EBW Analytics, “…hedge funds shorting the market may have seen early morning prices that were still near $2.60 as a last opportunity to pounce before the monster injections expected to begin next week drive gas prices down sharply.” All things considered, it’s been a slow wait for normal summer weather to kick in, but the Southeast is expected to experience notable heat sooner than later. You wouldn’t have guessed it based on index power rates and the state of the NYMEX prompt month.
Working natural gas in storage currently stands at 1,753 Bcf, which is 137 Bcf (8.5%) higher than this time last year and 274 Bcf (-13.5%) lower than the five-year average.
The June 2019 NYMEX Futures price began the day around $2.55/MMBtu prior to the report’s release and increased to $2.56/MMBtu after the report was posted.
Outlook for the Balance of Storage Season:
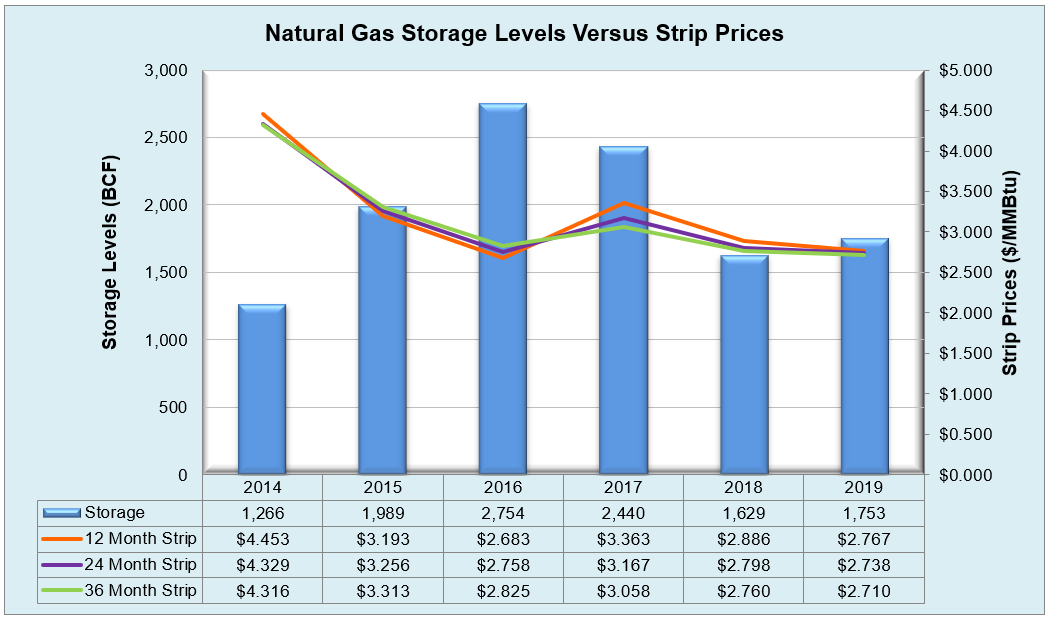
The graph below compares historical 12, 24 and 36 month strip prices and storage levels for the past 5 years.
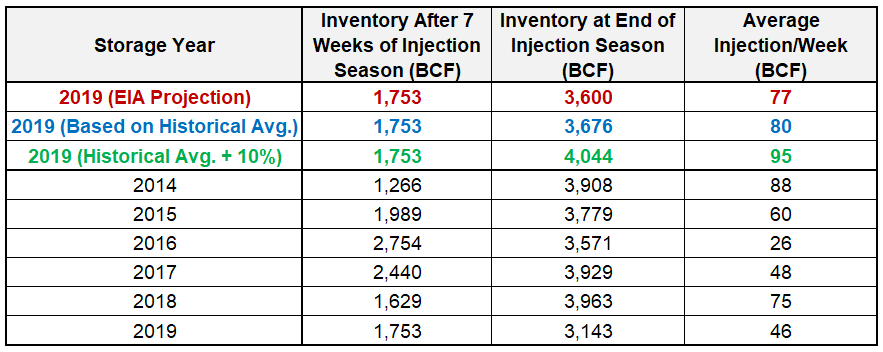
The following table shows the injection numbers we will need to average by week to hit selected historical levels:
The following two graphs show current natural gas in storage compared to each of the last 5 years and weekly storage averages and patterns.

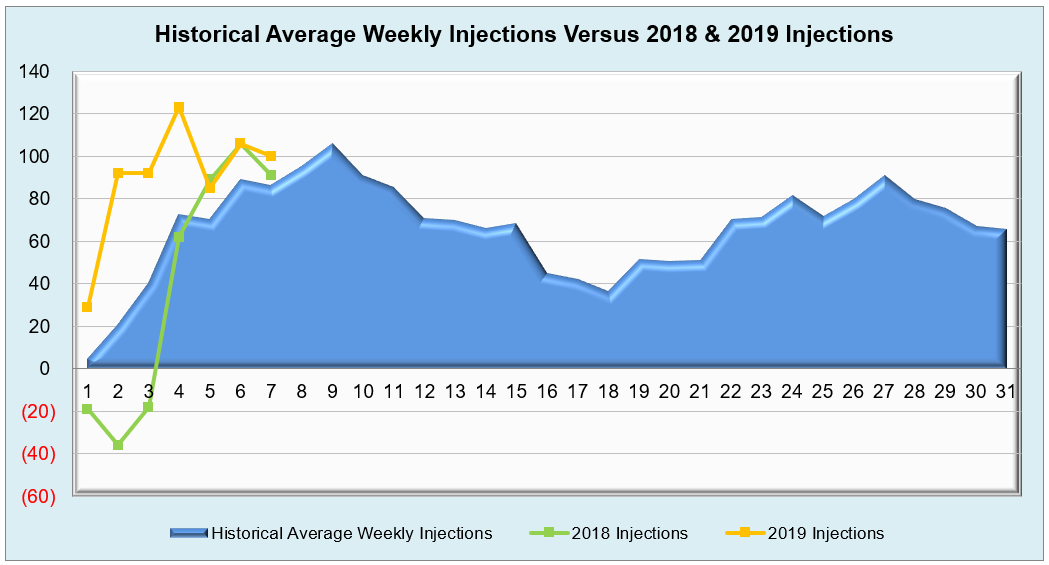
The graph below shows the injections through the current week over the past 5 years.

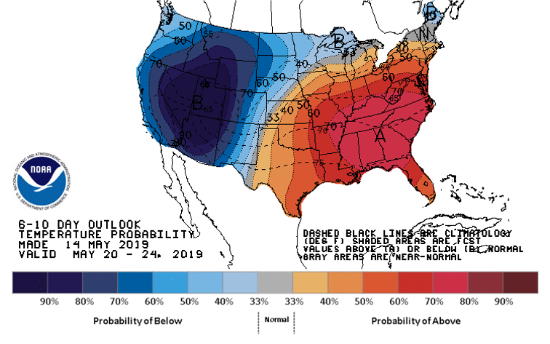
Finally, the graphics below depicts the 6 to 10 day temperature range outlook from the National Weather Service.
Current Week’s Outlook

Future Outlook