The Eastern region may have seen warmer weather during the reporting period, but cooler weather throughout the West and production nearly returning back to normal levels helped result in a substantial and bearish injection of 114 Bcf that eclipsed all market expectations, last year’s build of 95 Bcf, and the five-year average of 97 Bcf. Multiple weather trackers are showing a delay in the normal summer heat until a week or so into June, and storage inventories are wasting no time in shrinking the deficit that has hung over the market since last summer. Even the recent opening of the first Cameron LNG train and projected doubling of LNG exports over the course of 2019, NYMEX prompt month prices have stayed rangebound between $2.50/MMBtu and $2.70/MMBtu. The market may push lower if these triple-digit injections continue, and the EIA has estimated inventories should be back in line with the five-year average by the time November rolls back around. Even though it sounds like a broken record, little will change until the heat comes in, and neither the natural gas markets or power indexes are showing any signs of volatility momentarily.
Working natural gas in storage currently stands at 1,867 Bcf, which is 156 Bcf (9.1%) higher than this time last year and 257 Bcf (-12.1%) lower than the five-year average.
The July 2019 NYMEX Futures price began the day around $2.61/MMBtu prior to the report’s release and dropped to $2.55/MMBtu after the report was posted.

Outlook for the Balance of Storage Season:
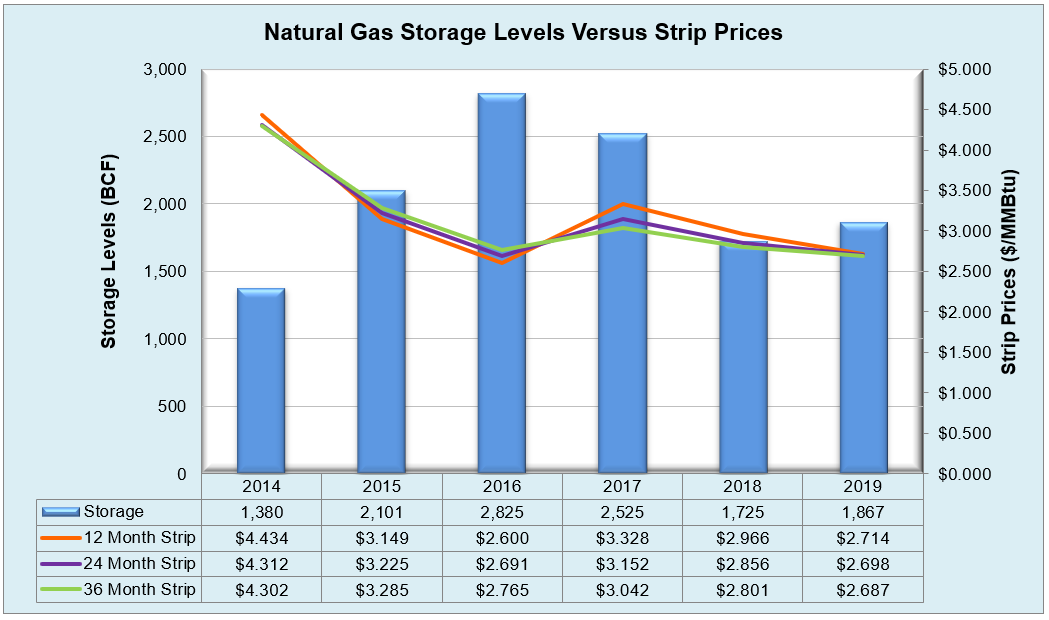
The graph below compares historical 12, 24 and 36 month strip prices and storage levels for the past 5 years.
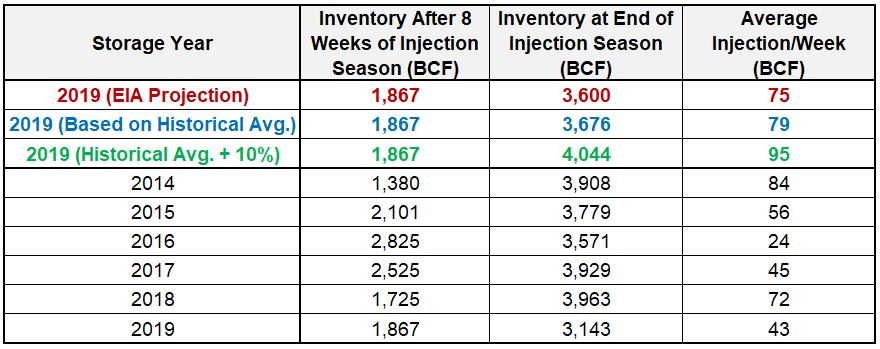
The following table shows the injection numbers we will need to average by week to hit selected historical levels:
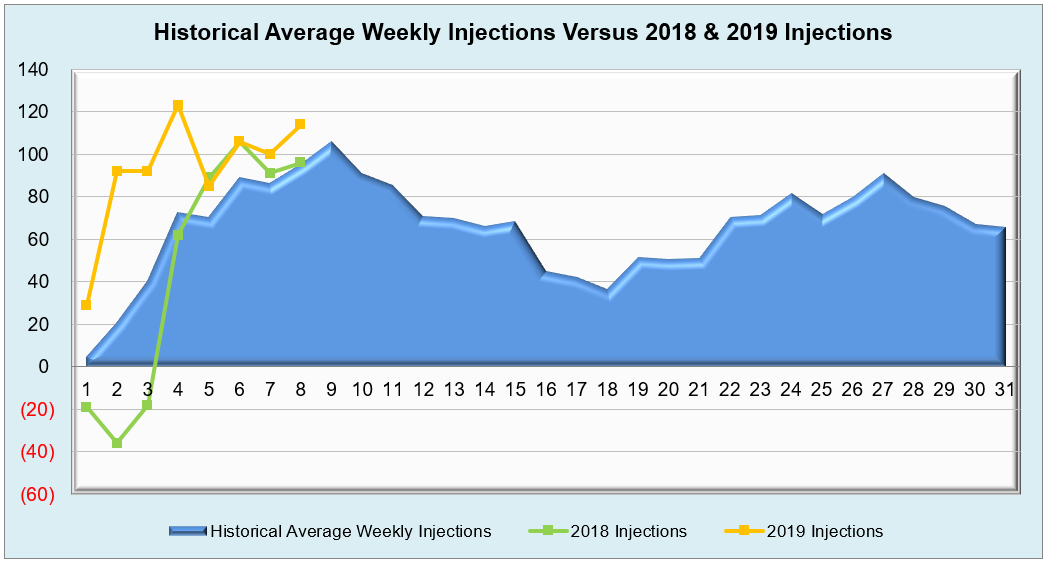
The following two graphs show current natural gas in storage compared to each of the last 5 years and weekly storage averages and patterns.
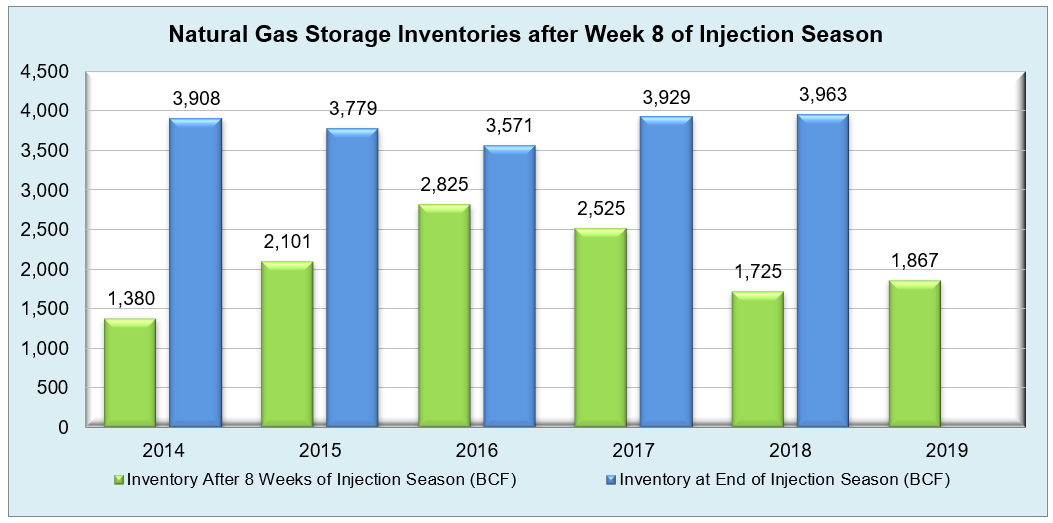
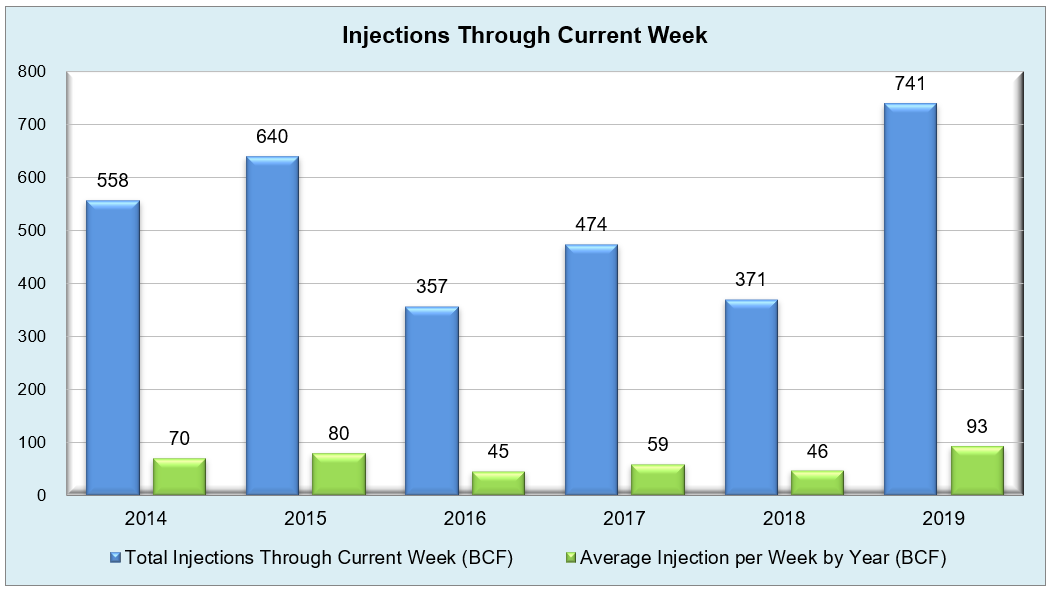
The graph below shows the injections through the current week over the past 5 years.
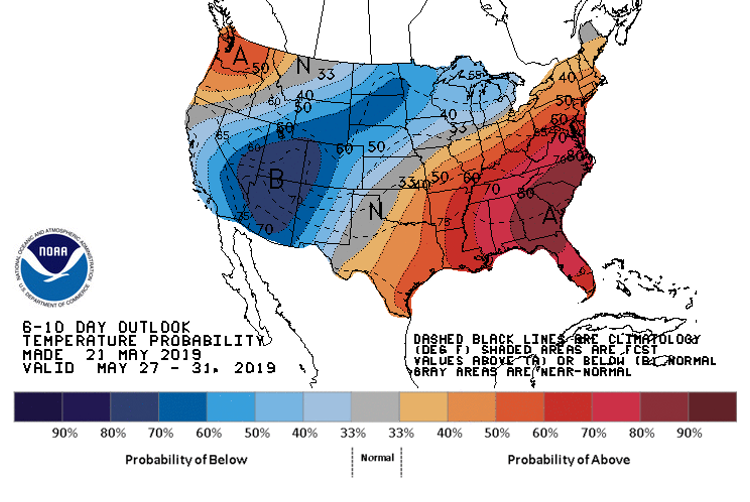
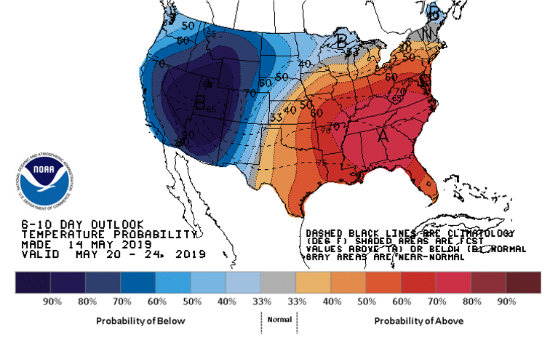
Finally, the graphics below depicts the 6 to 10 day temperature range outlook from the National Weather Service.
Current Week’s Outlook
Future Outlook