The largest withdrawal since the 288 Bcf pull on January 10th, 2014 occurred this morning, clocking in at a whopping 359 Bcf. This record-setting withdrawal not only managed to surpass the market expectation of a 333 Bcf net change, but also nearly doubled the draws from last year and the five-year average, which came in at -151 Bcf and -162 Bcf respectively. Outlooks for this winter proved to be mostly correct in their predictions of colder weather patterns so far, yet NYMEX has yet to maintain a steady hold over $3/MMBtu since the season began. Improvements and growth in capacity and production over the past few years have helped curb potential price spikes after events such as today’s withdrawal, and the relationship between storage and pricing has certainly transformed because of this. Warm temperatures are on the horizon over the next 11 to 15 days, so today’s record withdrawal more than likely won’t move the needle nearly as much as expected.
Working natural gas inventories currently stand at 2,767 Bcf. This figure is 415 Bcf (13.0%) less than this time last year and 382 Bcf (12.1%) below the five year average.
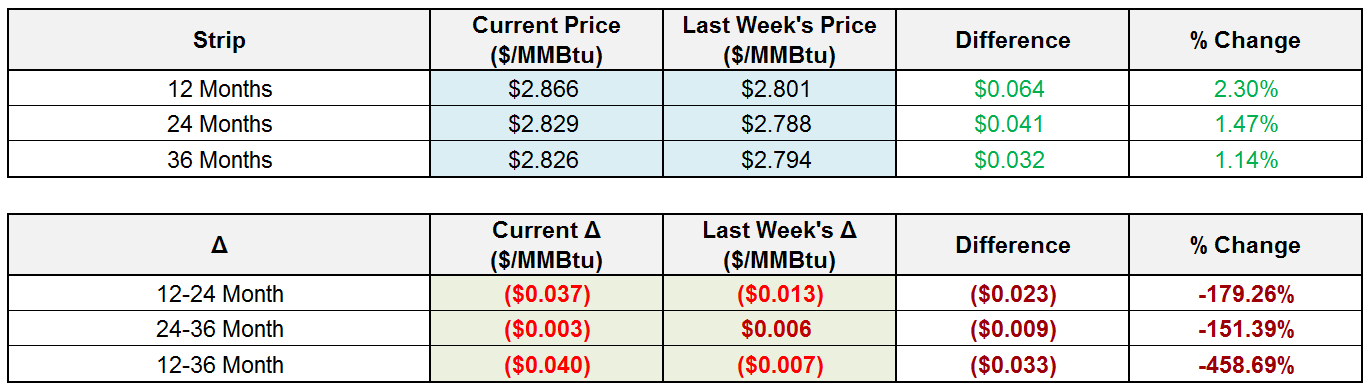
The February 2018 NYMEX Future was elevated at $3.01/MMBtu before the report’s release and has since increased even higher to $3.05/MMBtu.
Outlook for the Balance of Storage Season:
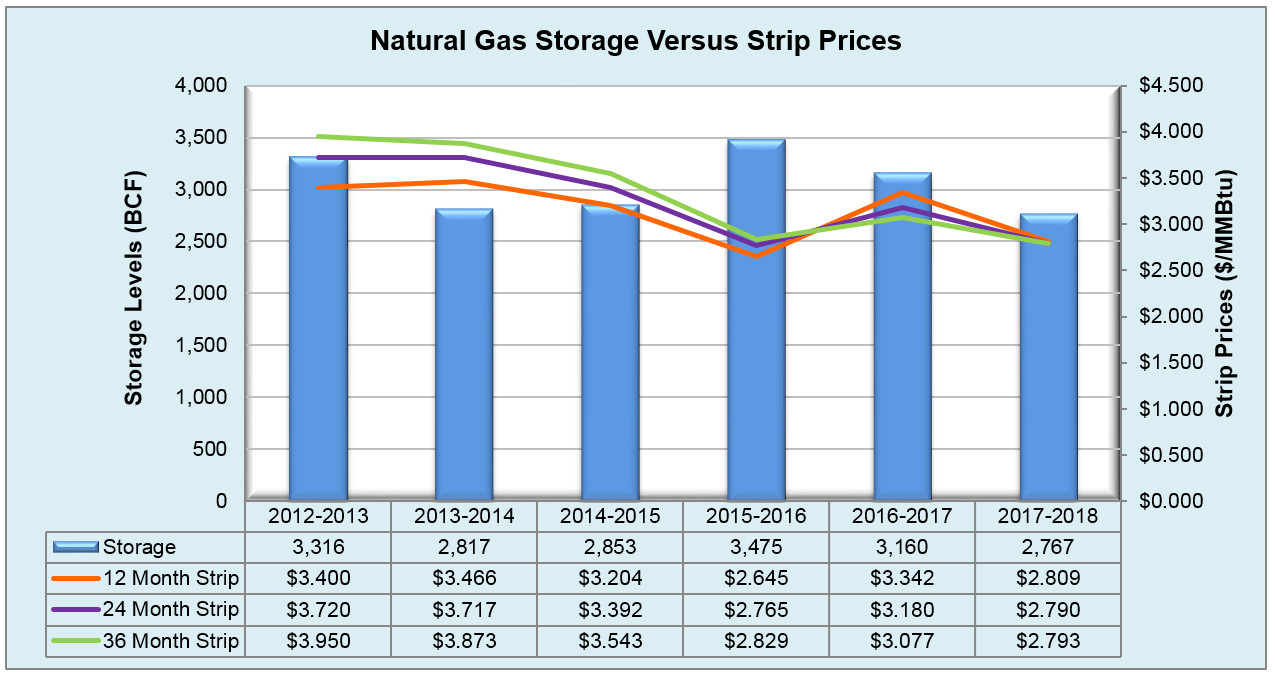
The graph below compares historical 12, 24 and 36 month strip prices and storage levels for the past 5 years.
The following table shows the injection numbers we will need to average by week to hit selected historical levels:

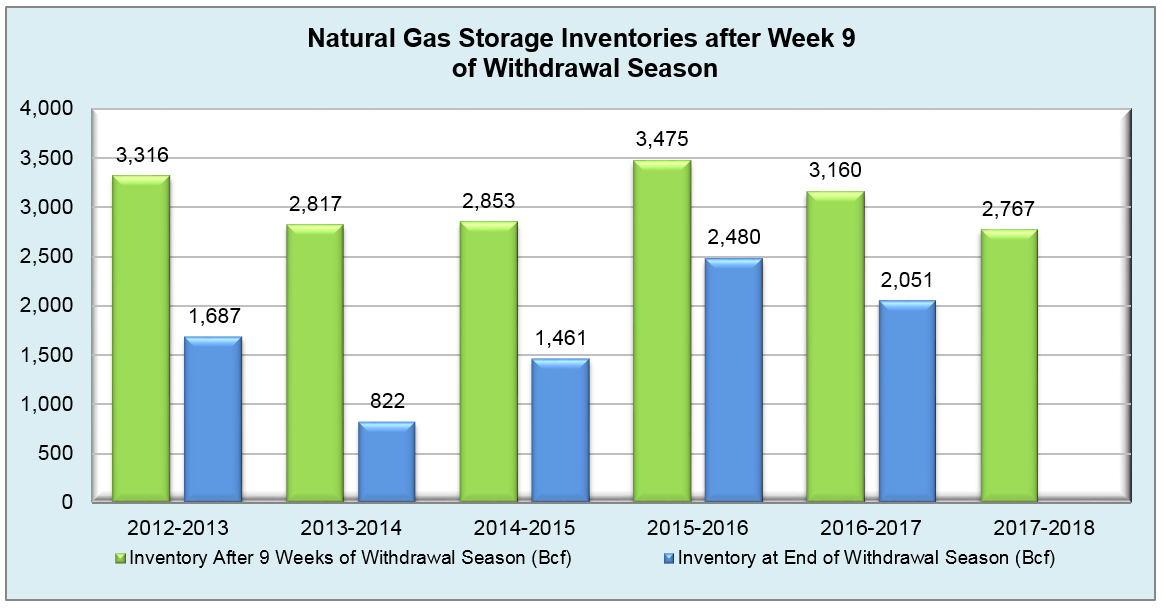
The following two graphs show current natural gas in storage compared to each of the last 5 years and weekly storage averages and patterns.
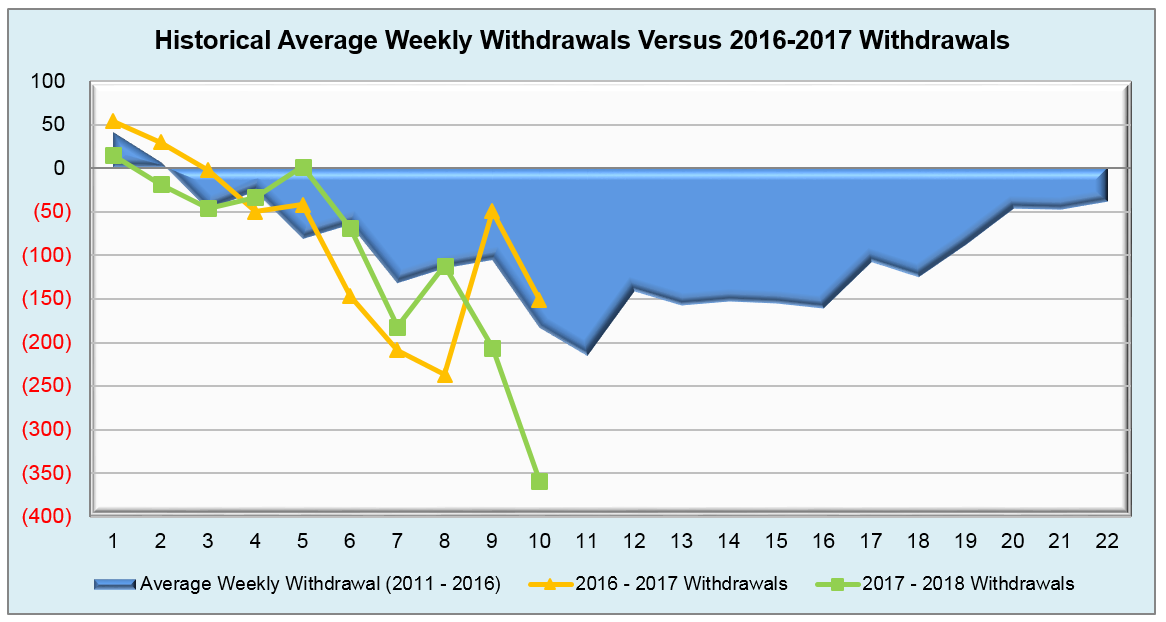
The graph below shows the injections through the current week over the past 5 years.

Finally, the graphics below depicts the 6 to 10 day temperature range outlook from the National Weather Service.
Current Week’s Outlook

Future Outlook
