Natural Gas Storage Report Withdrawal Season Week 17 (Week Ending February 23, 2018)

Heating demand continues to be unimpressive as this week’s withdrawal of 78 Bcf fell right in line with the market expectation of 77 Bcf. Last year, a paltry 7 Bcf was pulled, but the five-year average stands strong at a 118 Bcf withdrawal. Our current draw sits right in the middle of these past values, which is clearly reflected in our sideways market that has occurred over the past few weeks. On top of little confidence in colder weather patterns, the market has been showing signs of reaching record highs in production, which are alleviating the concerns of the large deficits to the storage inventories from last year and the five-year average. Fundamentally, very little news has arisen and nothing except for the aforementioned increased production, continued LNG exports, and focus on renewables seems to be enough to move the needle significantly. Mixed weather patterns are expected as we head into the shoulder months also.

Working natural gas inventories currently stand at 1,682 Bcf. This figure is 680 Bcf (28.8%) less than this time last year and 372 Bcf (118.1%) below the five year average.

The April 2018 NYMEX Futures price started around $2.69/MMBtu prior to the report’s release and has since increased to $2.70/MMBtu.

Outlook for the Balance of Storage Season:

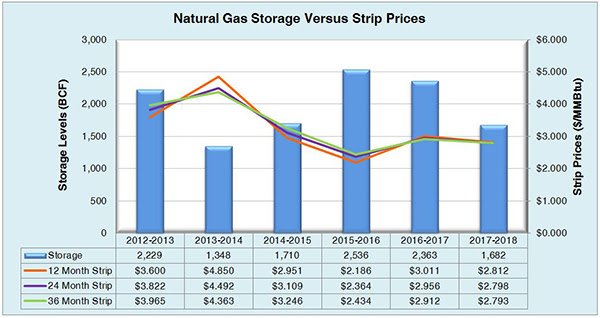
The graph below compares historical 12, 24 and 36 month strip prices and storage levels for the past 5 years.

The following table shows the injection numbers we will need to average by week to hit selected historical levels:

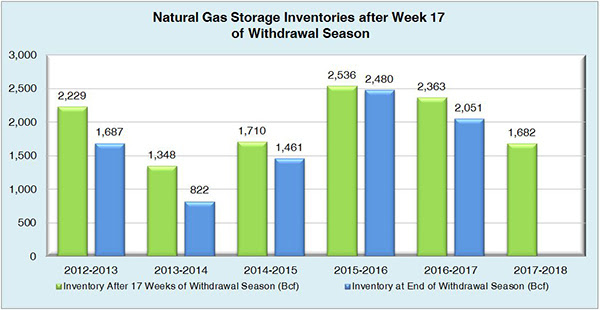
The following two graphs show current natural gas in storage compared to each of the last 5 years and weekly storage averages and patterns.

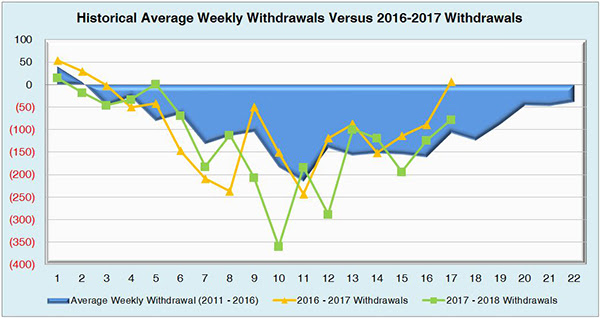
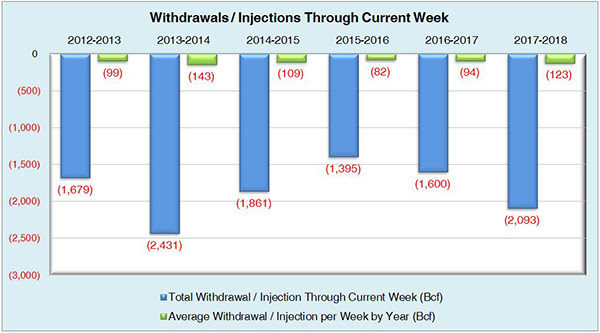
The graph below shows the injections through the current week over the past 5 years.

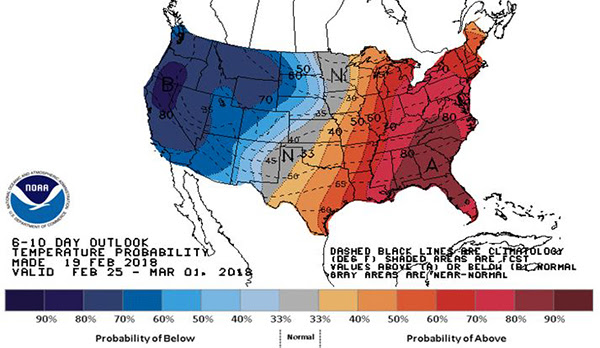
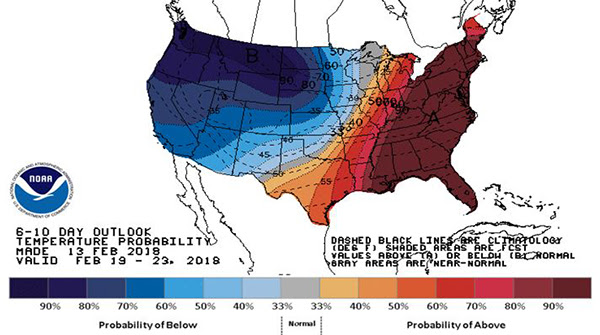
Finally, the graphics below depicts the 6 to 10 day temperature range outlook from the National Weather Service.

Current Week’s Outlook

Future Outlook