Shoulder season-like weather across much of the country to close out February created a stagnant market for the week ending March 2
nd. The prompt month opened the week at $2.70, while the week closed at a nearly identical $2.71. The lack of a weather related impact on the market was also on display in this week’s withdrawal number. The uninspiring withdrawal of 57 Bcf was in line with the expectation of 58 Bcf. As a result, there has been no market impact of which to speak. While the number matched last year’s withdrawal of 57 Bcf, the five year average withdrawal remained considerably stronger at 129 Bcf. Due to severe weather events across the Northeast, we may expect a different story to accompany next week’s number. It will be interesting to see if the impact is muted by the more than 1 million utility customers from Maryland to Maine who were/are without power. This could dampen the heating demand created by the weather pattern known as a nor’easter.
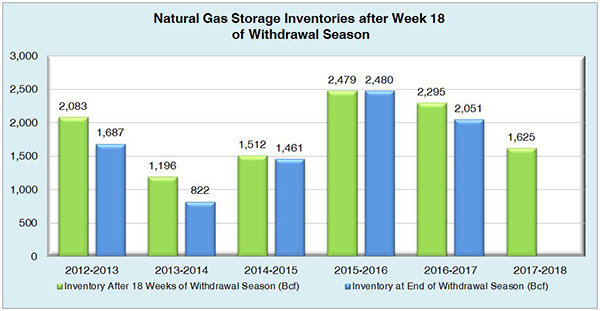
Working natural gas inventories currently stand at 1,625 Bcf. This figure is 680 Bcf (29.5%) less than this time last year and 300 Bcf (15.6%) below the five year average.
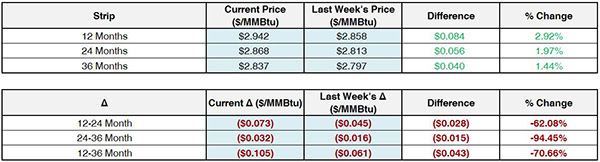
The April 2018 NYMEX Futures price started around $2.76/MMBtu prior to the report’s release and has since decreased to $2.75/MMBtu.
Outlook for the Balance of Storage Season:
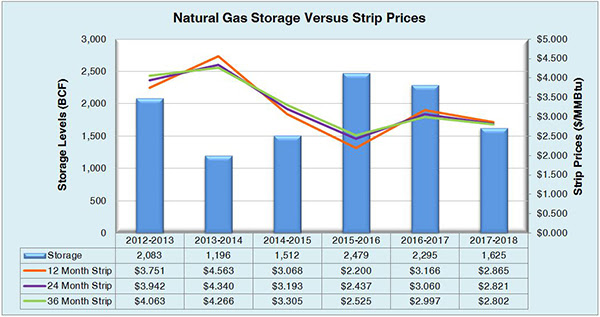
The graph below compares historical 12, 24 and 36 month strip prices and storage levels for the past 5 years.
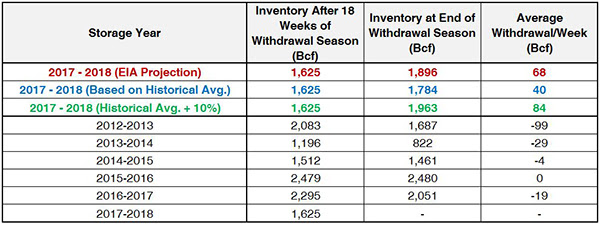
The following table shows the injection numbers we will need to average by week to hit selected historical levels:
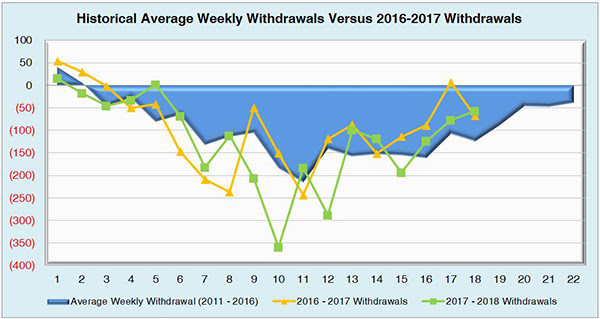
The following two graphs show current natural gas in storage compared to each of the last 5 years and weekly storage averages and patterns.
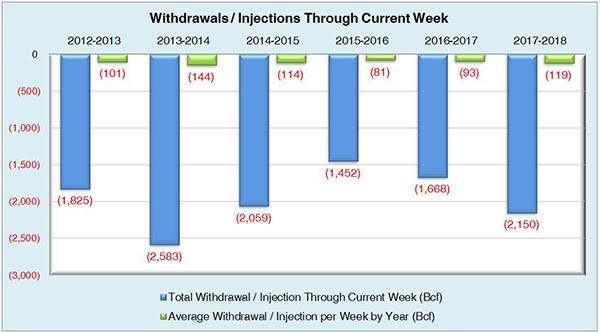
The graph below shows the injections through the current week over the past 5 years.
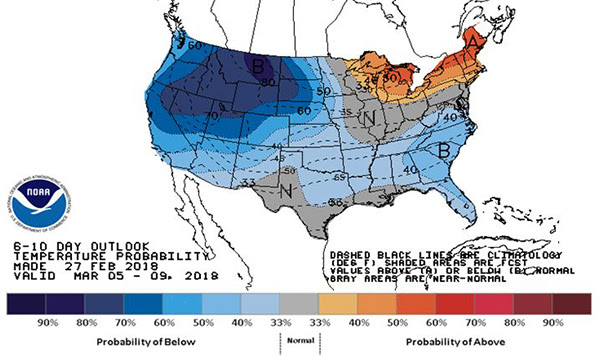
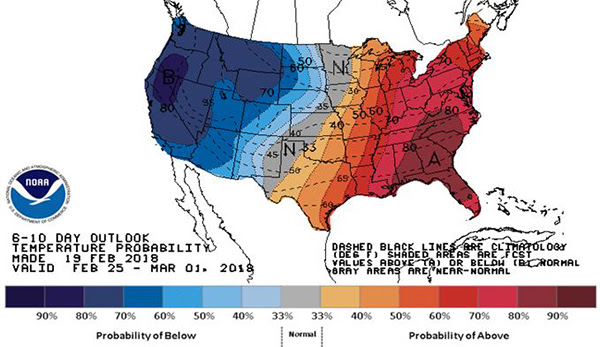
Finally, the graphics below depicts the 6 to 10 day temperature range outlook from the National Weather Service.
Current Week’s Outlook
Future Outlook