Working natural gas in storage currently stands at 3,626 Bcf, which is 201 Bcf (5.5%) less than this time last year and 27 Bcf (0.7%) below the five year average.
The January 2018 NYMEX future was slightly elevated at just under $2.70/MmBTU and has since retreated to just over $2.67/MmBTU.

Outlook for the Balance of Storage Season:
The graph below compares historical 12, 24 and 36 month strip prices and storage levels for the past 5 years.

The following table shows the injection numbers we will need to average by week to hit selected historical levels:

The following two graphs show current natural gas in storage compared to each of the last 5 years and weekly storage averages and patterns.


The graph below shows the injections through the current week over the past 5 years.

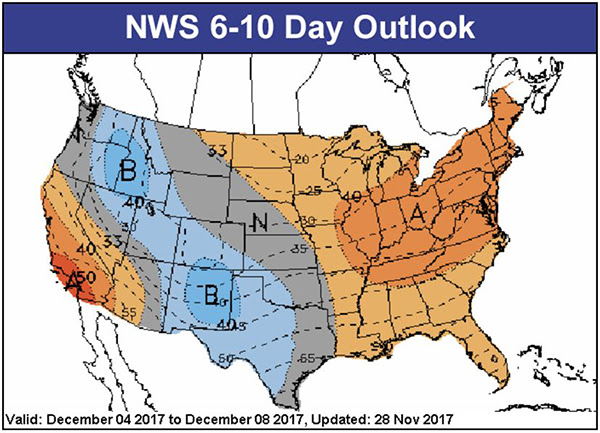
Finally, the graphics below depicts the 6 to 10 day temperature range outlook from the National Weather Service.
Current Week’s Outlook

Future Outlook

