|
Following an already elevated NYMEX due to recent colder weather patterns, this week’s 112 Bcf withdrawal fell right in line with the market expectation of 113 Bcf. While the current pull mirrors the five-year average withdrawal of 111 Bcf, it came in at nearly half of last year’s massive draw of 233 Bcf around the same time. It may seem that the market is bouncing back since the injection of 2 Bcf a few weeks ago, but natural gas bulls are going to need more than a handful of larger withdrawals and short blasts of cold weather to move the needle back to the $3/MMBtu mark. Despite predictions, we have seen an underwhelming withdrawal season thus far, but we still have some telling weather ahead that could shift that tone.
Working natural gas inventories currently stand at 3,332 Bcf. This figure is 62 Bcf (1.8%) less than this time last year and 85 Bcf (2.5%) below the five year average. The February 2018 NYMEX Future began at $2.88/MMBtu before the report’s release and has since shifted to $2.89/MMBtu.
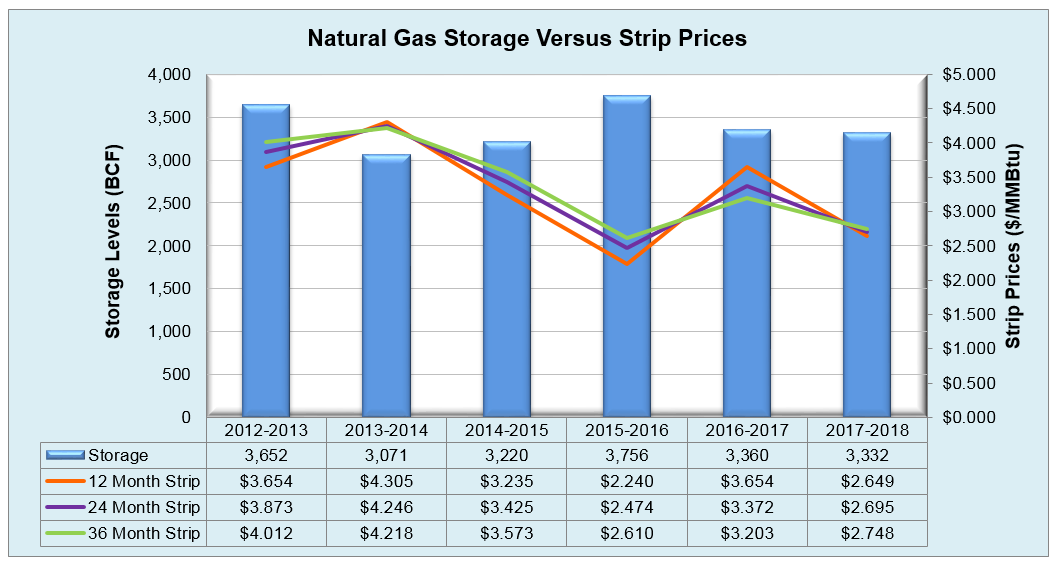
Outlook for the Balance of Storage Season: The graph below compares historical 12, 24 and 36 month strip prices and storage levels for the past 5 years. The following table shows the injection numbers we will need to average by week to hit selected historical levels:
The following two graphs show current natural gas in storage compared to each of the last 5 years and weekly storage averages and patterns.
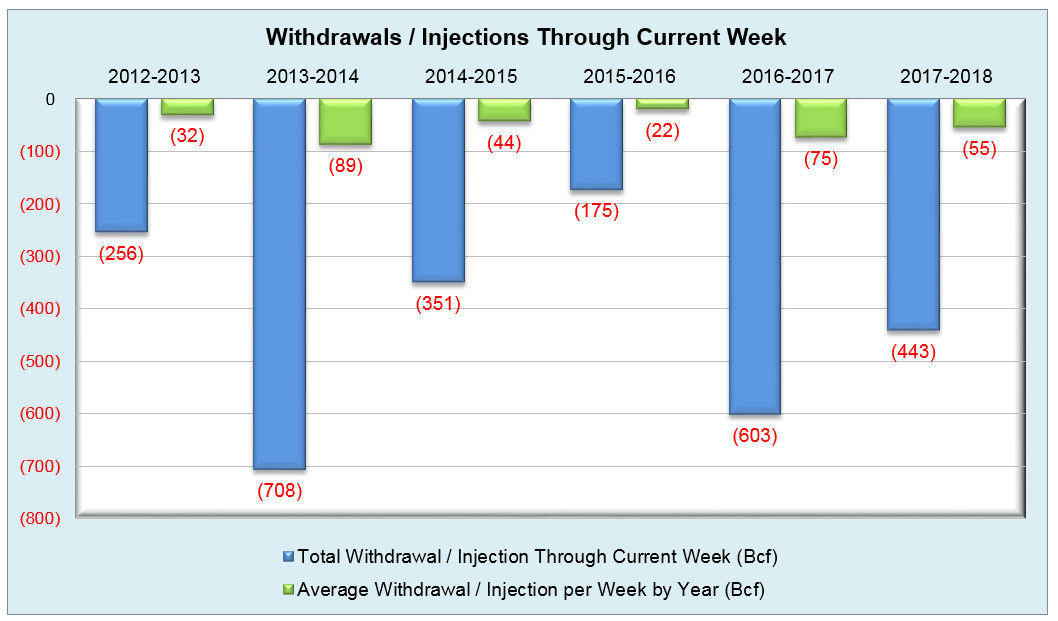
The graph below shows the injections through the current week over the past 5 years.
Finally, the graphics below depicts the 6 to 10 day temperature range outlook from the National Weather Service. Current Week’s Outlook Future Outlook |